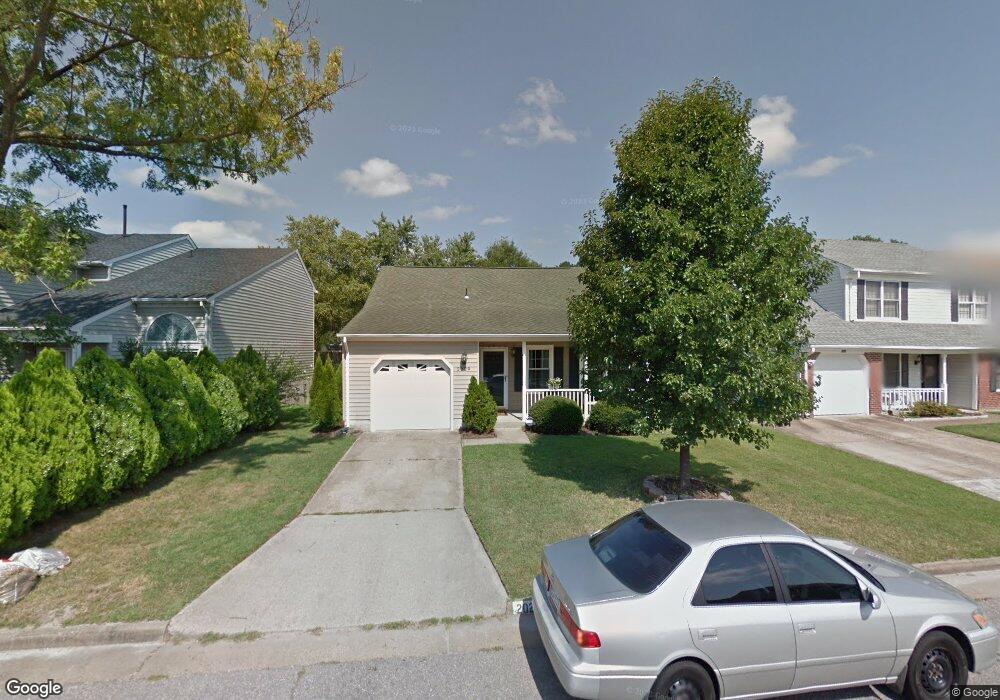
2029 Manassas Run Virginia Beach, VA 23464
Estimated Value: $405,546 - $431,000
3
Beds
3
Baths
1,748
Sq Ft
$238/Sq Ft
Est. Value
About This Home
This home is located at 2029 Manassas Run, Virginia Beach, VA 23464 and is currently estimated at $416,887, approximately $238 per square foot. 2029 Manassas Run is a home located in Virginia Beach City with nearby schools including Tallwood Elementary School, Brandon Middle School, and Tallwood High School.
Ownership History
Date
Name
Owned For
Owner Type
Purchase Details
Closed on
Mar 12, 2013
Sold by
Hagy Jeremy and Hagy Jessica
Bought by
Katkar Sachin D and Madkikar Ketaki J
Current Estimated Value
Home Financials for this Owner
Home Financials are based on the most recent Mortgage that was taken out on this home.
Original Mortgage
$192,800
Outstanding Balance
$135,930
Interest Rate
3.52%
Mortgage Type
New Conventional
Estimated Equity
$280,957
Purchase Details
Closed on
Sep 30, 2008
Sold by
Elliott David E
Bought by
Hagy Jeremy
Home Financials for this Owner
Home Financials are based on the most recent Mortgage that was taken out on this home.
Original Mortgage
$258,587
Interest Rate
6.54%
Mortgage Type
FHA
Purchase Details
Closed on
Dec 18, 2001
Sold by
Swann Robert T
Bought by
Elliot David E
Home Financials for this Owner
Home Financials are based on the most recent Mortgage that was taken out on this home.
Original Mortgage
$117,500
Interest Rate
6.61%
Create a Home Valuation Report for This Property
The Home Valuation Report is an in-depth analysis detailing your home's value as well as a comparison with similar homes in the area
Home Values in the Area
Average Home Value in this Area
Purchase History
| Date | Buyer | Sale Price | Title Company |
|---|---|---|---|
| Katkar Sachin D | $241,000 | -- | |
| Hagy Jeremy | $262,000 | -- | |
| Elliot David E | $117,500 | -- |
Source: Public Records
Mortgage History
| Date | Status | Borrower | Loan Amount |
|---|---|---|---|
| Open | Katkar Sachin D | $192,800 | |
| Previous Owner | Hagy Jeremy | $258,587 | |
| Previous Owner | Elliot David E | $117,500 |
Source: Public Records
Tax History Compared to Growth
Tax History
| Year | Tax Paid | Tax Assessment Tax Assessment Total Assessment is a certain percentage of the fair market value that is determined by local assessors to be the total taxable value of land and additions on the property. | Land | Improvement |
|---|---|---|---|---|
| 2025 | $3,331 | $360,000 | $157,500 | $202,500 |
| 2024 | $3,331 | $343,400 | $150,000 | $193,400 |
| 2023 | $3,223 | $325,600 | $135,000 | $190,600 |
| 2022 | $2,963 | $299,300 | $115,000 | $184,300 |
| 2021 | $2,568 | $259,400 | $94,000 | $165,400 |
| 2020 | $2,473 | $243,000 | $84,000 | $159,000 |
| 2019 | $2,486 | $244,300 | $80,000 | $164,300 |
| 2018 | $2,449 | $244,300 | $80,000 | $164,300 |
| 2017 | $2,251 | $224,500 | $75,000 | $149,500 |
| 2016 | $2,232 | $225,500 | $75,000 | $150,500 |
| 2015 | $2,095 | $211,600 | $74,800 | $136,800 |
| 2014 | $1,978 | $216,400 | $88,000 | $128,400 |
Source: Public Records
Map
Nearby Homes
- 5685 Glen View Dr
- 5928 Chain Bridge Rd
- 1832 Monument Dr
- 2205 Fort Belvoir Dr
- 5937 Ludington Dr
- 2104 Pateshall Ct
- 1873 Kempsville Crossing Ln
- 5800 Baynebridge Dr
- 1500 Blade Ct
- 1541 Orchard Grove Dr
- 1345 Simon Dr
- 1534 Carrolton Way
- 1439 Orchard Grove Dr
- 1969 Lisa Ct
- MM Sycamore
- MM Dogwood
- 661 Crestfield Dr
- 640 Crestfield Dr
- 1065 Messa Loop
- 1061 Messa Loop
- 2033 Manassas Run
- 2025 Manassas Run
- 2037 Manassas Run
- 2020 Mason Neck Ln
- 2021 Manassas Run
- 2041 Manassas Run
- 2024 Mason Neck Ln
- 2016 Mason Neck Ln
- 2017 Manassas Run
- 5617 Seven Pines Way
- 5621 Seven Pines Way
- 2045 Manassas Run
- 2013 Manassas Run
- 2012 Mason Neck Ln
- 2028 Manassas Run
- 2024 Manassas Run
- 2032 Manassas Run
- 2028 Mason Neck Ln
- 5613 Seven Pines Way
- 2036 Manassas Run