Estimated Value: $343,111 - $407,000
3
Beds
2
Baths
1,895
Sq Ft
$201/Sq Ft
Est. Value
About This Home
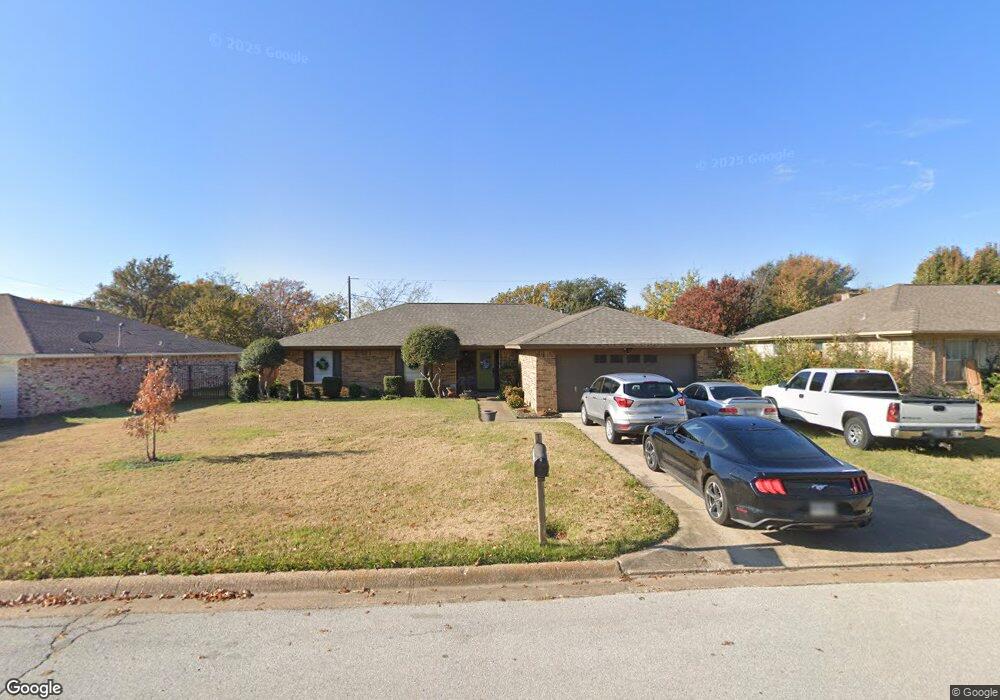
This home is located at 2029 Normandy Dr, Hurst, TX 76054 and is currently estimated at $380,278, approximately $200 per square foot. 2029 Normandy Dr is a home located in Tarrant County with nearby schools including Bedford Heights Elementary School, Bedford Junior High School, and L.D. Bell High School.
Ownership History
Date
Name
Owned For
Owner Type
Purchase Details
Closed on
Mar 30, 2001
Sold by
Hodges Nancy Louise
Bought by
Jacob Scott and Jacob Theresa M
Current Estimated Value
Home Financials for this Owner
Home Financials are based on the most recent Mortgage that was taken out on this home.
Original Mortgage
$123,561
Outstanding Balance
$45,922
Interest Rate
7.13%
Mortgage Type
FHA
Estimated Equity
$334,356
Purchase Details
Closed on
Mar 3, 1999
Sold by
Work Naith and Work Betty L
Bought by
Hodges Nancy Louise
Home Financials for this Owner
Home Financials are based on the most recent Mortgage that was taken out on this home.
Original Mortgage
$101,900
Interest Rate
6.73%
Purchase Details
Closed on
Aug 9, 1994
Sold by
Noonan Benjamin M and Noonan Diane L
Bought by
Hodges Nancy Louise and Work Naith
Home Financials for this Owner
Home Financials are based on the most recent Mortgage that was taken out on this home.
Original Mortgage
$95,000
Interest Rate
8.66%
Create a Home Valuation Report for This Property
The Home Valuation Report is an in-depth analysis detailing your home's value as well as a comparison with similar homes in the area
Home Values in the Area
Average Home Value in this Area
Purchase History
| Date | Buyer | Sale Price | Title Company |
|---|---|---|---|
| Jacob Scott | -- | Metroplex Title Inc | |
| Hodges Nancy Louise | -- | Commonwealth Land Title | |
| Hodges Nancy Louise | -- | First American Title Co |
Source: Public Records
Mortgage History
| Date | Status | Borrower | Loan Amount |
|---|---|---|---|
| Open | Jacob Scott | $123,561 | |
| Previous Owner | Hodges Nancy Louise | $101,900 | |
| Previous Owner | Hodges Nancy Louise | $95,000 |
Source: Public Records
Tax History
| Year | Tax Paid | Tax Assessment Tax Assessment Total Assessment is a certain percentage of the fair market value that is determined by local assessors to be the total taxable value of land and additions on the property. | Land | Improvement |
|---|---|---|---|---|
| 2025 | $4,610 | $288,000 | $75,000 | $213,000 |
| 2024 | $4,610 | $304,442 | $75,000 | $229,442 |
| 2023 | $6,008 | $329,173 | $55,000 | $274,173 |
| 2022 | $6,277 | $310,179 | $55,000 | $255,179 |
| 2021 | $5,977 | $247,846 | $55,000 | $192,846 |
| 2020 | $5,963 | $247,846 | $55,000 | $192,846 |
| 2019 | $5,590 | $256,518 | $55,000 | $201,518 |
| 2017 | $4,777 | $205,089 | $18,000 | $187,089 |
| 2016 | $4,342 | $192,598 | $18,000 | $174,598 |
Source: Public Records
Map
Nearby Homes
- 317 Northglen Dr
- 404 Mountainview Dr
- 421 Cavender Ct
- 417 Sunnybrook Ct
- 200 Eagle Ct
- 2204 Mountainview Dr
- 3002 Carolyn Ct
- 3006 Carolyn Ct
- 412 Elisha Dr
- 305 Warbler Dr
- 2244 Hurstview Dr
- 413 Blue Jay Ct
- 617 Indian Trail
- 440 W Louella Dr
- 201 W Louella Dr
- 410 Carolyn Dr
- 2157 Lookout Ct
- 2221 Farrington Ln
- 129 E Louella Dr
- 137 E Louella Dr
- 2033 Normandy Dr
- 2025 Normandy Dr
- 212 Stratford Ct
- 213 Stratford Ct
- 2037 Normandy Dr
- 2028 Normandy Dr
- 2032 Normandy Dr
- 208 Stratford Ct
- 2024 Normandy Dr
- 228 Carolyn Dr
- 2036 Normandy Dr
- 232 Carolyn Dr
- 2020 Normandy Dr
- 2041 Normandy Dr
- 209 Stratford Ct
- 2040 Normandy Dr
- 2029 Northglen Dr
- 204 Stratford Ct
- 2033 Northglen Dr
- 2025 Northglen Dr
Your Personal Tour Guide
Ask me questions while you tour the home.