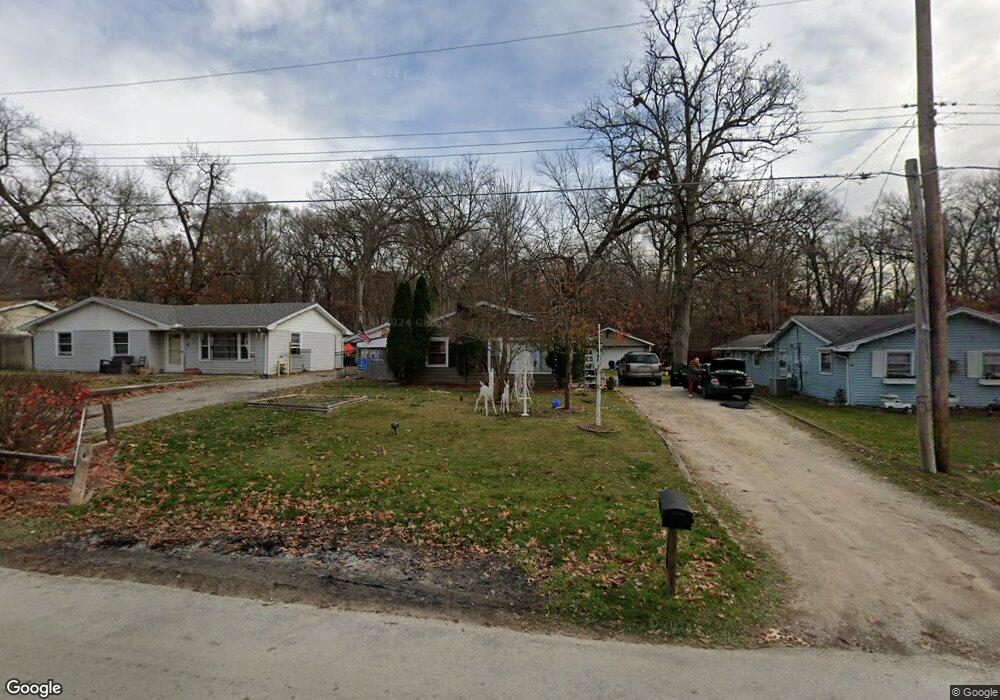
2029 Roberts St Wilmington, IL 60481
Estimated Value: $186,000 - $253,000
--
Bed
--
Bath
--
Sq Ft
0.29
Acres
About This Home
This home is located at 2029 Roberts St, Wilmington, IL 60481 and is currently estimated at $212,366. 2029 Roberts St is a home located in Will County with nearby schools including Bruning Elementary School, L.J. Stevens Intermediate School, and Wilmington Middle School.
Ownership History
Date
Name
Owned For
Owner Type
Purchase Details
Closed on
Mar 11, 2024
Sold by
Jeans Dawn O
Bought by
Jeans Dawn O and Veenstra Tonya M
Current Estimated Value
Purchase Details
Closed on
Mar 13, 2021
Sold by
Jeans James J
Bought by
Jeans James J and Jeans Dawn O
Purchase Details
Closed on
Aug 26, 2003
Sold by
Standard Bank & Trust Co
Bought by
Jeans James J
Home Financials for this Owner
Home Financials are based on the most recent Mortgage that was taken out on this home.
Original Mortgage
$113,680
Interest Rate
6.18%
Mortgage Type
FHA
Purchase Details
Closed on
Feb 5, 2003
Sold by
Mance David A and Wells Fargo Bank Minnesota Na
Bought by
Standard Bank & Trust Co and Trust #16560
Purchase Details
Closed on
Jan 23, 2003
Sold by
Mance David A and Wells Fargo Bank Minnesota Nat
Bought by
Standard Bank & Trust and Trust #16560
Create a Home Valuation Report for This Property
The Home Valuation Report is an in-depth analysis detailing your home's value as well as a comparison with similar homes in the area
Home Values in the Area
Average Home Value in this Area
Purchase History
| Date | Buyer | Sale Price | Title Company |
|---|---|---|---|
| Jeans Dawn O | -- | None Listed On Document | |
| Jeans James J | -- | None Available | |
| Jeans James J | $115,500 | Ticor Title | |
| Standard Bank & Trust Co | -- | -- | |
| Standard Bank & Trust | $65,319 | -- |
Source: Public Records
Mortgage History
| Date | Status | Borrower | Loan Amount |
|---|---|---|---|
| Previous Owner | Jeans James J | $113,680 |
Source: Public Records
Tax History Compared to Growth
Tax History
| Year | Tax Paid | Tax Assessment Tax Assessment Total Assessment is a certain percentage of the fair market value that is determined by local assessors to be the total taxable value of land and additions on the property. | Land | Improvement |
|---|---|---|---|---|
| 2024 | $3,309 | $57,648 | $14,105 | $43,543 |
| 2023 | $3,309 | $56,768 | $13,890 | $42,878 |
| 2022 | $3,135 | $52,033 | $12,731 | $39,302 |
| 2021 | $2,861 | $46,986 | $11,496 | $35,490 |
| 2020 | $2,731 | $44,431 | $10,871 | $33,560 |
| 2019 | $2,730 | $44,431 | $10,871 | $33,560 |
| 2018 | $2,746 | $44,431 | $10,871 | $33,560 |
| 2017 | $2,731 | $44,052 | $10,778 | $33,274 |
| 2016 | $2,574 | $42,188 | $10,322 | $31,866 |
| 2015 | $2,342 | $39,969 | $9,779 | $30,190 |
| 2014 | $2,342 | $39,185 | $9,587 | $29,598 |
| 2013 | $2,342 | $39,185 | $9,587 | $29,598 |
Source: Public Records
Map
Nearby Homes
- 1953 Lakewood Dr
- 1923 Bruning Dr
- 2005 Roberts St
- 1530 Vista Dr
- 5 Elmwood Ave
- 8 Elmwood Ave
- 2 Elmwood Ave
- 21741 W Grand Ave
- Lot 9-13 Hickory Ave
- 14 Hickory Ave
- 0000 Ryan St
- 810 Kristin Ln
- LOT 1 Kristin Ln
- 711 Koala Ct
- 21860 Illinois 113
- 31951 W River Rd
- 625 W Baltimore St
- 000 Rt 53 Hwy
- 119 S Washington St
- 20684 Illinois 102
- 2031 Roberts St
- 2027 Roberts St
- 2033 Roberts St
- 2025 Roberts St
- 2035 Roberts St
- 2023 Roberts St
- 2037 Roberts St
- 2026 Roberts St
- 2028 Roberts St
- 2022 Roberts St
- 2034 Roberts St
- 2019 Roberts St
- 2032 Roberts St
- 230 Wood St
- 2039 Roberts St
- 2020 Roberts St
- 226 Wood St
- 2017 Roberts St
- 2038 Roberts St
- 2010 Roberts St