Estimated Value: $198,863 - $247,000
3
Beds
1
Bath
1,081
Sq Ft
$212/Sq Ft
Est. Value
About This Home
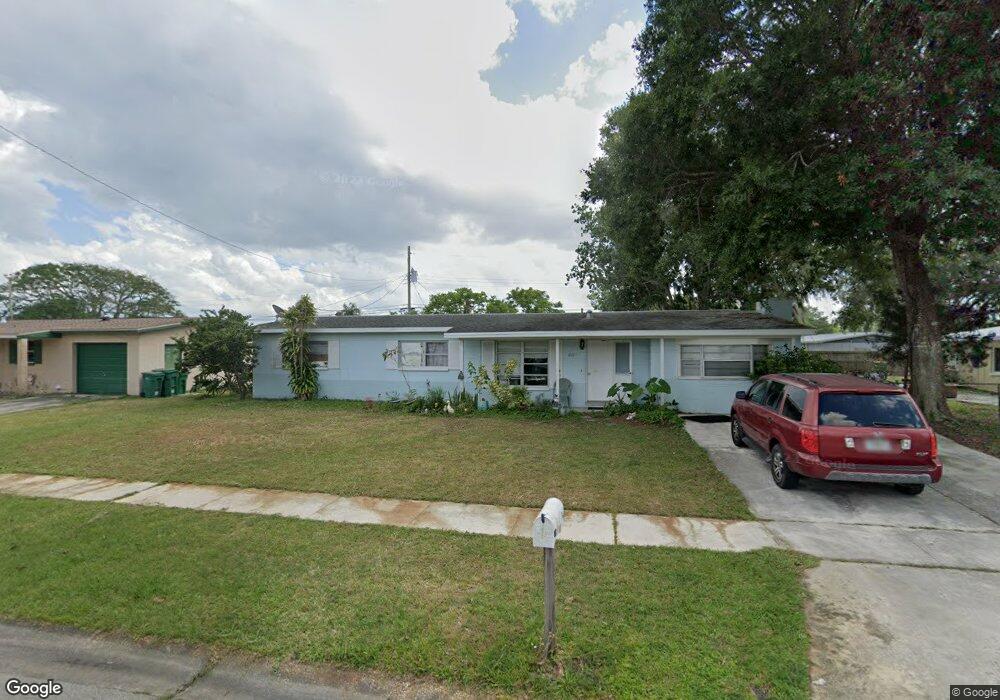
This home is located at 2029 Rollins Dr, Cocoa, FL 32922 and is currently estimated at $228,966, approximately $211 per square foot. 2029 Rollins Dr is a home located in Brevard County with nearby schools including Cambridge Elementary Magnet School, Cocoa High School, and Emma Jewel Charter Academy.
Ownership History
Date
Name
Owned For
Owner Type
Purchase Details
Closed on
Mar 9, 2026
Sold by
Roger C Vaughn Revocable Trust and Roger Vaughn
Bought by
Lawson Donna
Current Estimated Value
Purchase Details
Closed on
Jan 24, 2024
Sold by
Vaughn Roger C
Bought by
Roger C Vaughn Revocable Trust
Purchase Details
Closed on
Dec 29, 2000
Sold by
Dept Housing & Urban Dev Wa D C
Bought by
Vaughn Roger C
Purchase Details
Closed on
Aug 29, 2000
Sold by
Chase Manhattan Mtg Corp
Bought by
Housing & Urban Dev
Purchase Details
Closed on
Aug 3, 2000
Sold by
Clerk Circuit Court
Bought by
Chase Manhattan Mtg Corp
Purchase Details
Closed on
Jul 24, 1997
Sold by
Housing & Urban Dev
Bought by
Odaniel Sonja A
Home Financials for this Owner
Home Financials are based on the most recent Mortgage that was taken out on this home.
Original Mortgage
$69,300
Interest Rate
7.61%
Purchase Details
Closed on
Dec 3, 1996
Sold by
F T Mtg Co
Bought by
Housing & Urban Dev
Purchase Details
Closed on
Nov 19, 1996
Sold by
Clerk Circuit Court
Bought by
F T Mtg Co and 1St Tn Mtg Co Inc
Create a Home Valuation Report for This Property
The Home Valuation Report is an in-depth analysis detailing your home's value as well as a comparison with similar homes in the area
Home Values in the Area
Average Home Value in this Area
Purchase History
| Date | Buyer | Sale Price | Title Company |
|---|---|---|---|
| Roger C Vaughn Revocable Trust | $100 | None Listed On Document | |
| Roger C Vaughn Revocable Trust | $100 | None Listed On Document | |
| Vaughn Roger C | $48,100 | -- | |
| Housing & Urban Dev | -- | -- | |
| Chase Manhattan Mtg Corp | -- | -- | |
| Odaniel Sonja A | $48,100 | -- | |
| Housing & Urban Dev | -- | -- | |
| F T Mtg Co | -- | -- |
Source: Public Records
Mortgage History
| Date | Status | Borrower | Loan Amount |
|---|---|---|---|
| Previous Owner | Odaniel Sonja A | $69,300 |
Source: Public Records
Tax History
| Year | Tax Paid | Tax Assessment Tax Assessment Total Assessment is a certain percentage of the fair market value that is determined by local assessors to be the total taxable value of land and additions on the property. | Land | Improvement |
|---|---|---|---|---|
| 2025 | $2,554 | $171,440 | -- | -- |
| 2024 | $2,410 | $166,760 | -- | -- |
| 2023 | $2,410 | $156,790 | $40,000 | $116,790 |
| 2022 | $2,066 | $140,520 | $0 | $0 |
| 2021 | $1,744 | $88,190 | $36,000 | $52,190 |
| 2020 | $1,584 | $77,610 | $36,000 | $41,610 |
| 2019 | $1,533 | $78,680 | $36,000 | $42,680 |
| 2018 | $1,316 | $68,210 | $25,000 | $43,210 |
| 2017 | $1,182 | $52,380 | $17,000 | $35,380 |
| 2016 | $1,091 | $43,790 | $9,000 | $34,790 |
| 2015 | $475 | $36,670 | $9,000 | $27,670 |
| 2014 | $422 | $36,380 | $10,000 | $26,380 |
Source: Public Records
Map
Nearby Homes
- 1354 S Stetson Dr
- 2029 Ivy Dr
- 1750 Rosa St
- 1417 Walter St
- 0000 N Range Rd
- 1810 Dixon Blvd
- 0000 Null Unknown
- Xxx Rosetine St
- 2515 Fairfield Dr
- 1301 N Range Rd
- 703 Venus Dr
- 717 Lunar Lake Cir
- Unknown Vacant Land Canveral Grove
- 2319 Elon Dr
- 1711 Dixon Blvd Unit 198
- 0 University Ln
- 764 Lunar Lake Cir
- 766 Lunar Lake Cir
- 1644 Ruth St
- 2475 Mercury Dr
- 2025 Rollins Dr
- 1412 E Stetson Cir
- 2028 Cooper Dr
- 2024 Cooper Dr
- 1408 E Stetson Cir
- 2021 Rollins Dr
- 2028 Rollins Dr
- 2024 Rollins Dr
- 2020 Cooper Dr
- 1416 E Stetson Cir
- 2020 Rollins Dr
- 1411 E Stetson Cir
- 2017 Rollins Dr
- 1409 E Stetson Cir
- 1415 E Stetson Cir
- 2016 Cooper Dr
- 1426 E Stetson Cir
- 00 E Stetson Cir
- 0 E Stetson Cir
- 1407 E Stetson Cir
Your Personal Tour Guide
Ask me questions while you tour the home.