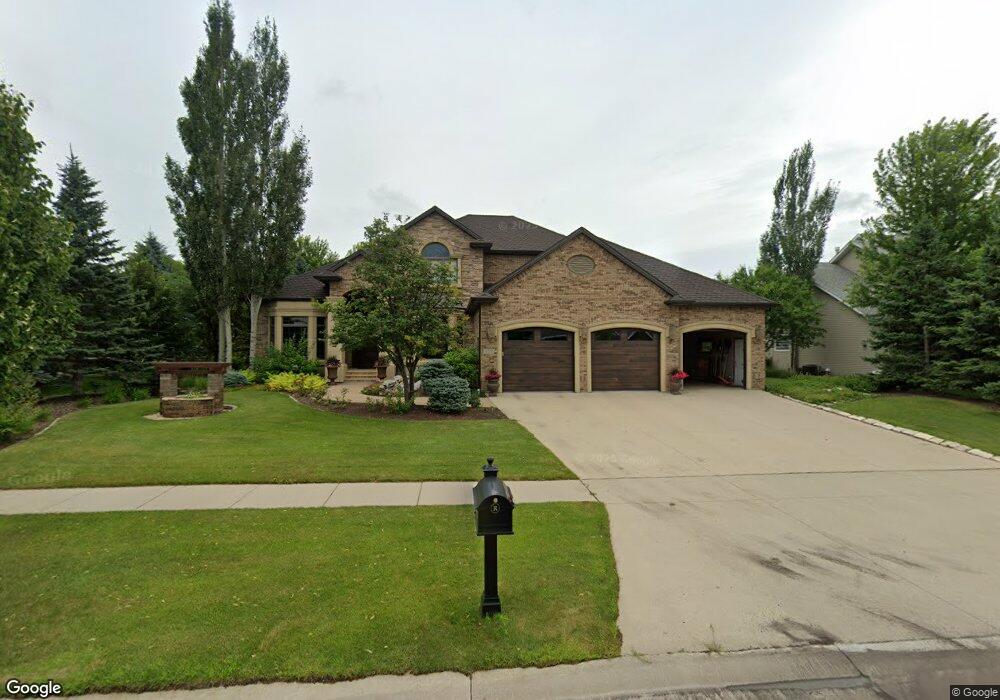
2029 Rose Creek Blvd S Fargo, ND 58104
Rose Creek NeighborhoodEstimated Value: $1,170,000 - $1,312,000
6
Beds
5
Baths
5,847
Sq Ft
$214/Sq Ft
Est. Value
About This Home
This home is located at 2029 Rose Creek Blvd S, Fargo, ND 58104 and is currently estimated at $1,254,023, approximately $214 per square foot. 2029 Rose Creek Blvd S is a home located in Cass County with nearby schools including Centennial Elementary School, Discovery Middle School, and Fargo Davies High School.
Ownership History
Date
Name
Owned For
Owner Type
Purchase Details
Closed on
Jul 25, 2017
Sold by
Pickrel Jay and Pickrel Guadalupe
Bought by
Strande Larry G and Strande Sharon R
Current Estimated Value
Purchase Details
Closed on
May 16, 2014
Sold by
Brandt Ace A
Bought by
Pickrel Jay and Pickrel Guadalupe
Home Financials for this Owner
Home Financials are based on the most recent Mortgage that was taken out on this home.
Original Mortgage
$668,000
Interest Rate
4.34%
Mortgage Type
Purchase Money Mortgage
Purchase Details
Closed on
Nov 30, 2008
Sold by
Brandt Michele L
Bought by
Brandt Ace A
Purchase Details
Closed on
Nov 1, 2005
Sold by
Rohl Regan and Rohl Renae
Bought by
Brandt Ace A
Home Financials for this Owner
Home Financials are based on the most recent Mortgage that was taken out on this home.
Original Mortgage
$578,172
Interest Rate
5.75%
Mortgage Type
Adjustable Rate Mortgage/ARM
Create a Home Valuation Report for This Property
The Home Valuation Report is an in-depth analysis detailing your home's value as well as a comparison with similar homes in the area
Home Values in the Area
Average Home Value in this Area
Purchase History
| Date | Buyer | Sale Price | Title Company |
|---|---|---|---|
| Strande Larry G | -- | Title Co | |
| Pickrel Jay | $1,285,000 | Valley Title & Escrow | |
| Brandt Ace A | -- | -- | |
| Brandt Ace A | -- | -- |
Source: Public Records
Mortgage History
| Date | Status | Borrower | Loan Amount |
|---|---|---|---|
| Previous Owner | Pickrel Jay | $668,000 | |
| Previous Owner | Brandt Ace A | $578,172 |
Source: Public Records
Tax History Compared to Growth
Tax History
| Year | Tax Paid | Tax Assessment Tax Assessment Total Assessment is a certain percentage of the fair market value that is determined by local assessors to be the total taxable value of land and additions on the property. | Land | Improvement |
|---|---|---|---|---|
| 2024 | $16,241 | $594,050 | $84,650 | $509,400 |
| 2023 | $16,128 | $576,750 | $84,650 | $492,100 |
| 2022 | $13,698 | $487,650 | $85,700 | $401,950 |
| 2021 | $12,658 | $455,750 | $85,700 | $370,050 |
| 2020 | $12,588 | $455,750 | $85,700 | $370,050 |
| 2019 | $12,601 | $455,750 | $53,550 | $402,200 |
| 2018 | $12,461 | $455,750 | $53,550 | $402,200 |
| 2017 | $12,929 | $455,750 | $53,550 | $402,200 |
| 2016 | $12,511 | $455,750 | $53,550 | $402,200 |
| 2015 | $12,183 | $414,300 | $35,200 | $379,100 |
| 2014 | $12,449 | $414,300 | $35,200 | $379,100 |
| 2013 | $11,075 | $360,500 | $35,200 | $325,300 |
Source: Public Records
Map
Nearby Homes
- 2009 Rose Creek Blvd S
- 4902 Rose Creek Pkwy S
- 1341 E Rose Creek Pkwy S Unit 8
- 2508 Rose Creek Pkwy S
- 5309 18th St S
- 2553 54th Ave S
- 5050 Prosperity Way S
- 2427 Victoria Rose Dr S
- 1818 Rose Creek Dr S
- 2621 57th Ave S
- Somerset Plan at Timber Creek
- Riviera Plan at Timber Creek
- Pinehurst Plan at Timber Creek
- Roberta Plan at Timber Creek
- Dutton Plan at Timber Creek
- Cypress Plan at Timber Creek
- Sarah Plan at Timber Creek
- Mia Plan at Timber Creek
- Maria Plan at Timber Creek
- Ava Plan at Timber Creek
- 2025 Rose Creek Blvd S
- 2033 Rose Creek Blvd S
- 2019 Rose Creek Blvd S
- 2037 Rose Creek Blvd S
- 2065 Rose Creek Blvd S
- 2069 Rose Creek Blvd S
- 2071 Rose Creek Blvd S
- 2015 Rose Creek Blvd S
- 2057 Rose Creek Blvd S
- 2043 Rose Creek Blvd S
- 2079 Rose Creek Blvd S
- 2053 Rose Creek Blvd S
- 2005 Rose Creek Blvd S
- 2049 Rose Creek Blvd S
- 2103 Rose Creek Blvd S
- 2109 Rose Creek Blvd S
- 2001 Rose Creek Blvd S
- 2014 Rose Creek Blvd S
- 2014 Rose Creek Blvd S
- 2020 Rose Creek Blvd S