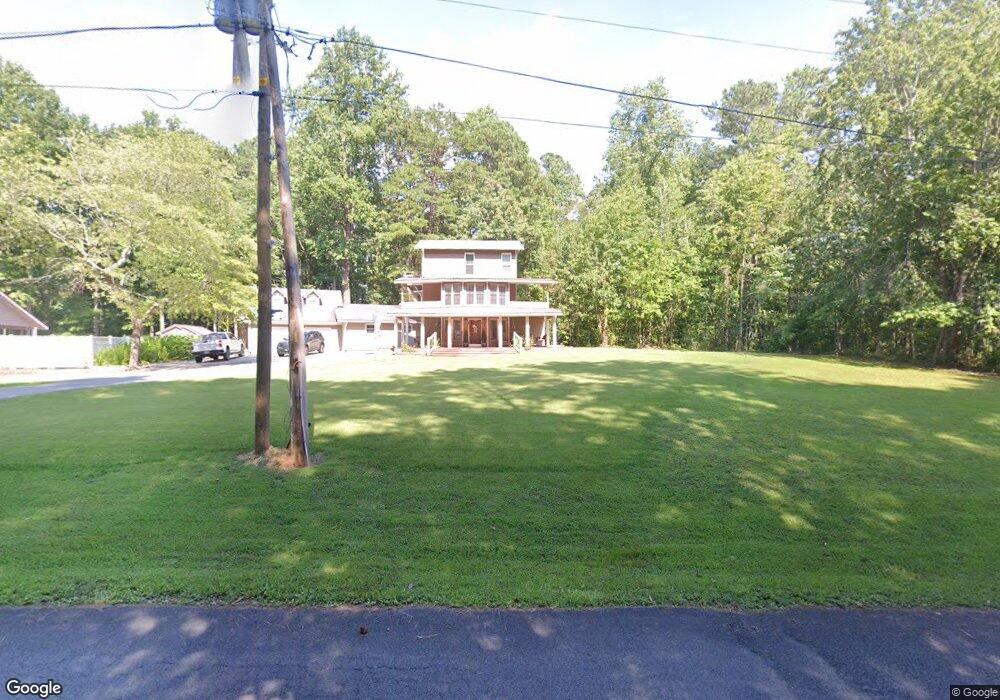
2029 Waterloo Dr SE Dalton, GA 30721
Estimated Value: $354,000 - $396,000
--
Bed
2
Baths
2,288
Sq Ft
$163/Sq Ft
Est. Value
About This Home
This home is located at 2029 Waterloo Dr SE, Dalton, GA 30721 and is currently estimated at $372,022, approximately $162 per square foot. 2029 Waterloo Dr SE is a home located in Whitfield County with nearby schools including Cedar Ridge Elementary School, Eastbrook Middle School, and Southeast Whitfield County High School.
Ownership History
Date
Name
Owned For
Owner Type
Purchase Details
Closed on
Oct 29, 2021
Sold by
Gaston Nancy L Wright
Bought by
Scott Shaun Edward and Scott Tonya Lee
Current Estimated Value
Purchase Details
Closed on
Sep 6, 2013
Sold by
Wright Nancy L
Bought by
Gaston Ira L and Gaston Nancy L
Home Financials for this Owner
Home Financials are based on the most recent Mortgage that was taken out on this home.
Original Mortgage
$165,000
Interest Rate
4.31%
Mortgage Type
New Conventional
Purchase Details
Closed on
Nov 1, 1993
Bought by
Wright Nancy L
Create a Home Valuation Report for This Property
The Home Valuation Report is an in-depth analysis detailing your home's value as well as a comparison with similar homes in the area
Home Values in the Area
Average Home Value in this Area
Purchase History
| Date | Buyer | Sale Price | Title Company |
|---|---|---|---|
| Scott Shaun Edward | $335,000 | -- | |
| Gaston Ira L | -- | -- | |
| Wright Nancy L | $88,000 | -- |
Source: Public Records
Mortgage History
| Date | Status | Borrower | Loan Amount |
|---|---|---|---|
| Previous Owner | Gaston Ira L | $165,000 |
Source: Public Records
Tax History Compared to Growth
Tax History
| Year | Tax Paid | Tax Assessment Tax Assessment Total Assessment is a certain percentage of the fair market value that is determined by local assessors to be the total taxable value of land and additions on the property. | Land | Improvement |
|---|---|---|---|---|
| 2024 | $2,385 | $147,530 | $15,000 | $132,530 |
| 2023 | $2,385 | $86,461 | $11,200 | $75,261 |
| 2022 | $1,797 | $69,484 | $11,200 | $58,284 |
| 2021 | $1,798 | $69,484 | $11,200 | $58,284 |
| 2020 | $1,847 | $69,484 | $11,200 | $58,284 |
| 2019 | $1,773 | $66,284 | $8,000 | $58,284 |
| 2018 | $1,994 | $72,570 | $7,200 | $65,370 |
| 2017 | $1,995 | $72,570 | $7,200 | $65,370 |
| 2016 | $1,714 | $65,411 | $4,620 | $60,791 |
| 2014 | $1,562 | $65,411 | $4,620 | $60,791 |
| 2013 | -- | $65,410 | $4,620 | $60,790 |
Source: Public Records
Map
Nearby Homes
- 1142 Ben Hill Rd SE
- 3657 Airport Rd
- 2200 Ridge Rd SE
- 01 Headrick Cir SE
- 00 Headrick Cir SE
- 1271 Ridge Rd SE
- 296 Wagner Dr
- 00 Hill Rd
- 760 Keith Rd SE
- 4322 Banks Dr SE
- 00 Tibbs Bridge Rd
- 1401 Eastbrook Dr SE
- 185 Cedar Ridge Rd
- 0 Tibbs Bridge Rd SE
- 118 Hill Rd
- 136 Wiltshire Dr
- 1401 Eastbrook Rd SE
- TBD Old Grade Rd
- 0 Old Grade Rd
- 4386 Tibbs Bridge Rd SE
- 2022 Waterloo Dr SE
- 2021 Waterloo Dr SE
- 2035 Waterloo Dr SE
- 2034 Waterloo Dr SE
- 2017 Waterloo Dr SE
- 233 Matlock Dr SE
- 2018 Waterloo Dr SE
- 227 Matlock Dr SE
- 237 Matlock Dr SE
- 2015 Waterloo Dr SE
- 219 Matlock Dr SE
- 2040 Waterloo Dr SE
- 111-112 Matlock Dr Unit 111 &112
- 230 Matlock Dr SE
- 2014 Waterloo Dr SE
- 241 Matlock Dr SE
- 234 Matlock Dr SE
- 0 Matlock Dr SE
- 214 Matlock Dr SE
- 2009 Waterloo Dr SE