2029 Waymont Rd Columbus, OH 43229
Forest Park East NeighborhoodEstimated Value: $207,000 - $302,000
3
Beds
3
Baths
1,750
Sq Ft
$158/Sq Ft
Est. Value
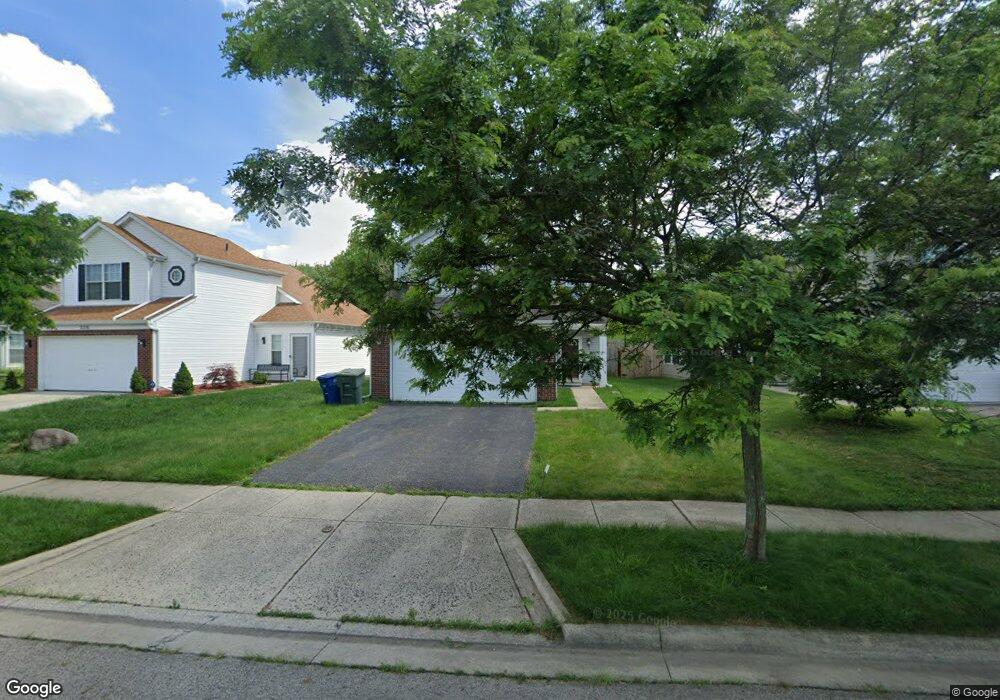
About This Home
This home is located at 2029 Waymont Rd, Columbus, OH 43229 and is currently estimated at $276,491, approximately $157 per square foot. 2029 Waymont Rd is a home located in Franklin County with nearby schools including Northtowne Elementary School, Woodward Park Middle School, and Northland High School.
Ownership History
Date
Name
Owned For
Owner Type
Purchase Details
Closed on
Mar 28, 2018
Sold by
Omar Omar S S
Bought by
Igen Omar A
Current Estimated Value
Purchase Details
Closed on
Jun 28, 2016
Sold by
Jpmorgan Chase Bank Na
Bought by
Barrett Dylan E and Barrett Dylan
Purchase Details
Closed on
May 2, 2005
Sold by
Hud
Bought by
Barrett Dylan and Barrett Paula
Purchase Details
Closed on
Sep 27, 2004
Sold by
Sedlock Christopher M and Union Federal Bank Of Indianap
Bought by
Hud
Purchase Details
Closed on
Jun 27, 2000
Sold by
M/I Schottenstein Homes Inc
Bought by
Hunt Angela C and Sedlock Chris M
Home Financials for this Owner
Home Financials are based on the most recent Mortgage that was taken out on this home.
Original Mortgage
$122,416
Interest Rate
8.66%
Mortgage Type
FHA
Create a Home Valuation Report for This Property
The Home Valuation Report is an in-depth analysis detailing your home's value as well as a comparison with similar homes in the area
Home Values in the Area
Average Home Value in this Area
Purchase History
| Date | Buyer | Sale Price | Title Company |
|---|---|---|---|
| Igen Omar A | $103,000 | None Available | |
| Barrett Dylan E | $99,500 | None Available | |
| Barrett Dylan | $111,000 | Lakeside Ti | |
| Hud | $110,000 | -- | |
| Hunt Angela C | $125,100 | Transohio Residential Title |
Source: Public Records
Mortgage History
| Date | Status | Borrower | Loan Amount |
|---|---|---|---|
| Previous Owner | Hunt Angela C | $122,416 |
Source: Public Records
Tax History Compared to Growth
Tax History
| Year | Tax Paid | Tax Assessment Tax Assessment Total Assessment is a certain percentage of the fair market value that is determined by local assessors to be the total taxable value of land and additions on the property. | Land | Improvement |
|---|---|---|---|---|
| 2024 | $3,527 | $78,580 | $17,500 | $61,080 |
| 2023 | $3,482 | $78,575 | $17,500 | $61,075 |
| 2022 | $2,652 | $51,140 | $8,750 | $42,390 |
| 2021 | $2,657 | $51,140 | $8,750 | $42,390 |
| 2020 | $2,661 | $51,140 | $8,750 | $42,390 |
| 2019 | $2,642 | $40,080 | $7,000 | $33,080 |
| 2018 | $2,509 | $40,080 | $7,000 | $33,080 |
| 2017 | $2,580 | $40,080 | $7,000 | $33,080 |
| 2016 | $2,847 | $41,900 | $8,890 | $33,010 |
| 2015 | $2,592 | $41,900 | $8,890 | $33,010 |
| 2014 | $2,598 | $41,900 | $8,890 | $33,010 |
| 2013 | $1,408 | $46,025 | $9,345 | $36,680 |
Source: Public Records
Map
Nearby Homes
- 4714 Ascot Dr
- 2033 Brittany Rd
- 4849 Heatherton Dr
- 2134 Trent Rd
- 4885 Northtowne Blvd
- 2244 Balmoral Rd
- 2158 Kilbourne Ave
- 5056 Northtowne Blvd Unit 5054
- 2058 Northcliff Dr
- 4309 Walford St
- 5124 Northcliff Loop W
- 1704 Riverbirch Dr
- 5022 Sienna Ln
- 4923 Karl Rd Unit 4925
- 4852 Colonel Perry Dr
- 2144 Colfax Ave
- 4217 Hickman Rd
- 5204 Honeytree Loop W
- 0 Claridon Rd
- 4761 Colonel Perry Dr
- 2023 Waymont Rd
- 2035 Waymont Rd
- 2017 Waymont Rd
- 2041 Waymont Rd
- 2011 Waymont Rd
- 2047 Waymont Rd
- 2005 Waymont Rd
- 2053 Waymont Rd
- 2028 Waymont Rd
- 2022 Waymont Rd
- 2034 Waymont Rd
- 2059 Waymont Rd
- 2040 Waymont Rd
- 1999 Waymont Rd
- 4696 Ascot Dr
- 2046 Waymont Rd
- 2065 Waymont Rd
- 2052 Waymont Rd
- 4702 Ascot Dr
- 1993 Waymont Rd