203 160th St SE Bothell, WA 98012
Estimated Value: $668,000 - $931,000
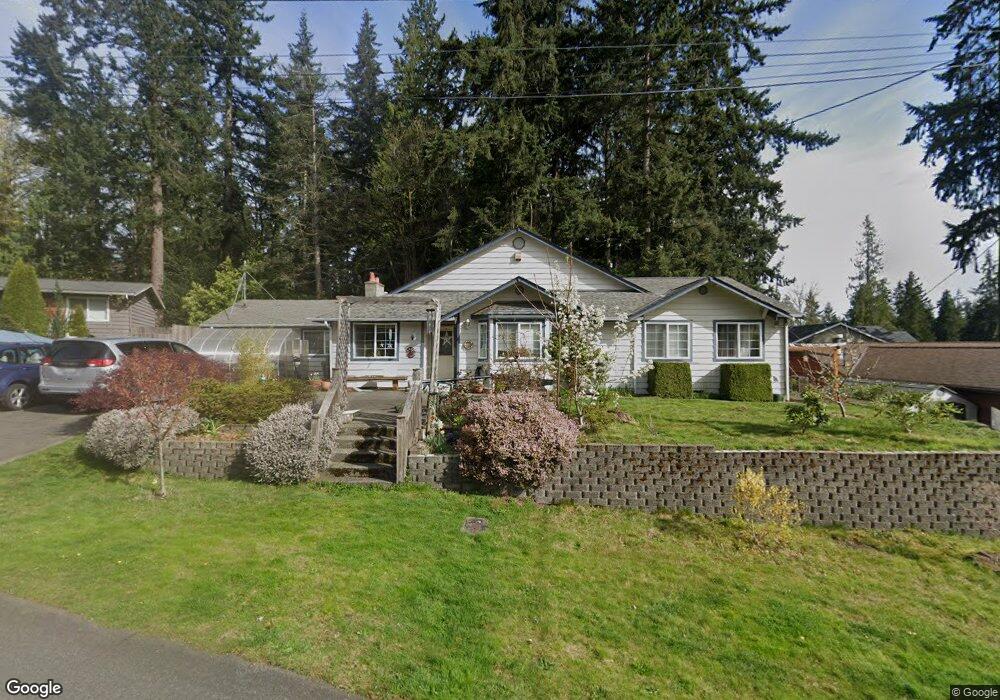
About This Home
This home is located at 203 160th St SE, Bothell, WA 98012 and is currently estimated at $823,164, approximately $373 per square foot. 203 160th St SE is a home located in Snohomish County with nearby schools including Oak Heights Elementary School, Alderwood Middle School, and Lynnwood High School.
Ownership History
We collect this data history from publicly available records. To have your information removed, we recommend requesting removal directly through your county’s website.
Purchase Details
Purchase Details
Purchase Details
Home Financials for this Owner
Home Financials are based on the most recent Mortgage that was taken out on this home.Purchase Details
Home Values in the Area
Average Home Value in this Area
Purchase History
We collect this data history from publicly available records. To have your information removed, we recommend requesting removal directly through your county’s website.
| Date | Buyer | Sale Price | Title Company |
|---|---|---|---|
| -- | Servicelink | ||
| $332,885 | None Available | ||
| $304,000 | Stewart Title | ||
| $2,750 | Pioneer National Title Insur |
Mortgage History
We collect this data history from publicly available records. To have your information removed, we recommend requesting removal directly through your county’s website.
| Date | Status | Borrower | Loan Amount |
|---|---|---|---|
| Previous Owner | $304,000 |
Tax History
We collect this data history from publicly available records. To have your information removed, we recommend requesting removal directly through your county’s website.
| Year | Tax Paid | Tax Assessment Tax Assessment Total Assessment is a certain percentage of the fair market value that is determined by local assessors to be the total taxable value of land and additions on the property. | Land | Improvement |
|---|---|---|---|---|
| 2026 | $5,822 | $769,500 | $495,000 | $274,500 |
| 2025 | $5,738 | $702,200 | $435,000 | $267,200 |
| 2024 | $5,738 | $689,800 | $415,000 | $274,800 |
| 2023 | $6,192 | $779,800 | $470,000 | $309,800 |
| 2022 | $6,022 | $618,300 | $362,000 | $256,300 |
| 2020 | $5,580 | $505,300 | $281,000 | $224,300 |
| 2019 | $5,112 | $460,200 | $240,000 | $220,200 |
| 2018 | $5,091 | $403,900 | $205,000 | $198,900 |
| 2017 | $4,258 | $349,000 | $165,000 | $184,000 |
| 2016 | $3,547 | $290,400 | $149,000 | $141,400 |
| 2015 | $3,359 | $260,900 | $133,000 | $127,900 |
| 2013 | $3,036 | $223,600 | $117,000 | $106,600 |
Map
- 101 161st St SE
- 17 159th Place SE
- 16 160th Place SE
- 107 164th St SE Unit 3-402
- 107 164th St SE Unit 2-301
- 9 160th Place SE
- 15620 3rd Dr SE
- 16230 3rd Ave SE Unit A1
- 15 xxx 3rd Ave SE
- 201 156th Place SW Unit MG 13
- 217 156th Place SW Unit MG 09
- 332 163rd Place SE
- 16223 5th Ave SE
- 412 164th Place SE
- 15530 2nd Place W Unit MG 16
- 16516 2nd Park SE
- 16526 2nd Ave SE
- 16528 2nd Park SE
- 16533 2nd Park SE
- 15327 3rd Dr SE
- 207 160th St SE
- 18 160th St SE
- 20 160th St SE
- 9 160th St SE
- 123 160th St SE
- 206 159th St SE
- 205 159th St SE
- 211 160th St SE
- 124 160th St SE
- 202 160th St SE
- 204 160th St SE
- 126 160th St SE
- 209 159th St SE
- 208 160th St SE
- 219 160th St SE
- 214 159th St SE
- 15911 Cascadian Way
- 16025 Cascadian Way
- 213 161st St SE
- 220 160th St SE
Ask me questions while you tour the home.