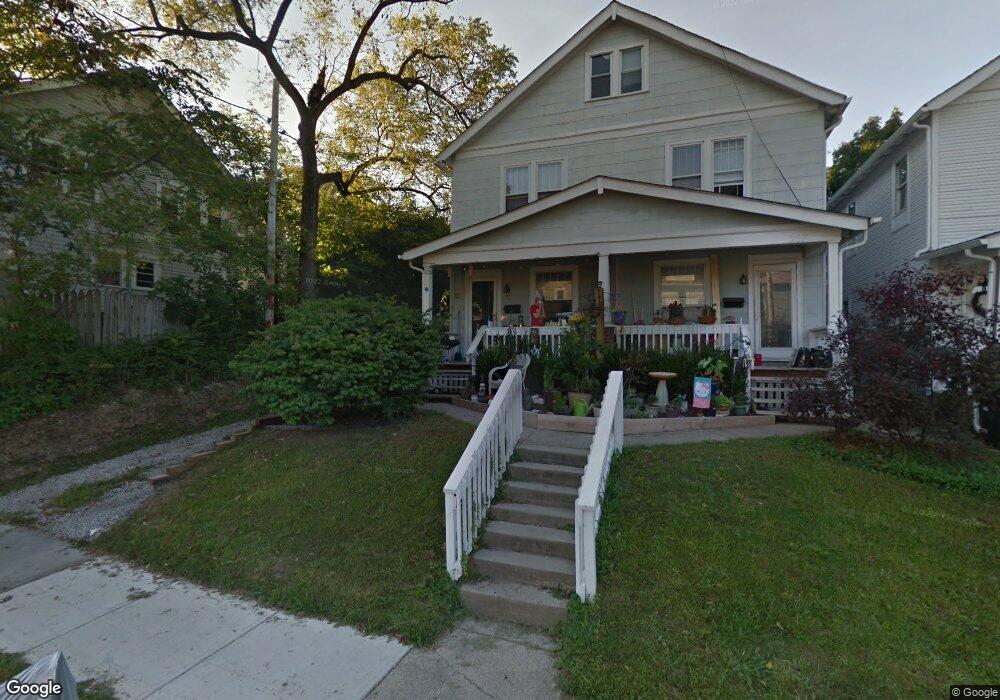
203-205 E Duncan St Columbus, OH 43202
Old North Columbus NeighborhoodEstimated Value: $384,260 - $438,000
6
Beds
2
Baths
2,204
Sq Ft
$192/Sq Ft
Est. Value
About This Home
This home is located at 203-205 E Duncan St, Columbus, OH 43202 and is currently estimated at $423,815, approximately $192 per square foot. 203-205 E Duncan St is a home located in Franklin County with nearby schools including Clinton Elementary School, Dominion Middle School, and Whetstone High School.
Ownership History
Date
Name
Owned For
Owner Type
Purchase Details
Closed on
Dec 16, 2017
Sold by
Mattmuller Adam Z and Tomezak Jessica
Bought by
Howard Devin and Howard Jessica
Current Estimated Value
Home Financials for this Owner
Home Financials are based on the most recent Mortgage that was taken out on this home.
Original Mortgage
$196,000
Outstanding Balance
$164,542
Interest Rate
3.92%
Mortgage Type
New Conventional
Estimated Equity
$259,274
Purchase Details
Closed on
Jan 4, 2014
Sold by
Mccoy James F and Wells Fargo Bank Na
Bought by
Federal Home Loan Mortgage Corporation
Purchase Details
Closed on
Aug 4, 2000
Sold by
Mccoy James F
Bought by
Mccoy James M and Mccoy Rita M
Home Financials for this Owner
Home Financials are based on the most recent Mortgage that was taken out on this home.
Original Mortgage
$80,000
Interest Rate
8.19%
Purchase Details
Closed on
Jul 28, 1987
Bought by
Mccoy James F
Create a Home Valuation Report for This Property
The Home Valuation Report is an in-depth analysis detailing your home's value as well as a comparison with similar homes in the area
Home Values in the Area
Average Home Value in this Area
Purchase History
| Date | Buyer | Sale Price | Title Company |
|---|---|---|---|
| Howard Devin | $245,000 | Heart Of Ohio Title Co | |
| Howard Devin | $245,000 | Heart Of Ohio Title Co | |
| Federal Home Loan Mortgage Corporation | $94,000 | None Available | |
| Federal Home Loan Mortgage Corporation | $94,000 | None Available | |
| Mccoy James M | -- | Amerititle Agency Inc | |
| Mccoy James M | -- | Amerititle Agency Inc | |
| Mccoy James F | $53,900 | -- | |
| Mccoy James F | $53,900 | -- |
Source: Public Records
Mortgage History
| Date | Status | Borrower | Loan Amount |
|---|---|---|---|
| Open | Howard Devin | $196,000 | |
| Previous Owner | Mccoy James M | $80,000 |
Source: Public Records
Tax History Compared to Growth
Tax History
| Year | Tax Paid | Tax Assessment Tax Assessment Total Assessment is a certain percentage of the fair market value that is determined by local assessors to be the total taxable value of land and additions on the property. | Land | Improvement |
|---|---|---|---|---|
| 2024 | $4,984 | $108,750 | $32,660 | $76,090 |
| 2023 | $4,922 | $108,750 | $32,660 | $76,090 |
| 2022 | $4,548 | $85,580 | $13,830 | $71,750 |
| 2021 | $4,556 | $85,580 | $13,830 | $71,750 |
| 2020 | $4,563 | $85,580 | $13,830 | $71,750 |
| 2019 | $5,332 | $85,750 | $10,640 | $75,110 |
| 2018 | $5,012 | $85,750 | $10,640 | $75,110 |
| 2017 | $3,097 | $50,400 | $10,640 | $39,760 |
| 2016 | $3,061 | $45,050 | $5,530 | $39,520 |
| 2015 | $2,645 | $45,050 | $5,530 | $39,520 |
| 2014 | $2,793 | $45,050 | $5,530 | $39,520 |
| 2013 | $1,311 | $42,875 | $5,250 | $37,625 |
Source: Public Records
Map
Nearby Homes
- 2537 Medary Ave Unit 539
- 109-117 E Arcadia Ave
- 363 E Hudson St Unit 365
- 204 E Blake Ave Unit 206
- 2399 Indianola Ave
- 415 Glen Echo Cir
- 241 E Blake Ave
- 6 E Blake Ave
- 2362 Indiana Ave
- 2350 Indiana Ave
- 43 W Blake Ave Unit 45
- 2804 Indianola Ave
- 2683 Neil Ave Unit 685
- 217 E Oakland Ave
- 2828 Kensington Place W
- 203 E Tulane Rd
- 2394 Neil Ave
- 2295 N 4th St
- 381 E Oakland Ave
- 99 W Oakland Ave
- 203-205 E Duncan St Unit 203-205
- 203 E Duncan St Unit 205
- 207 E Duncan St
- 207 E Duncan St
- 207 E Duncan St Unit 209
- 207-209 E Duncan St
- 195 E Duncan St
- 193 E Duncan St
- 0 Medary Ave
- 191 E Duncan St
- 2613 Medary Ave Unit 615
- 2613-2615 Medary Ave
- 2617 Medary Ave Unit 619
- 2609 Medary Ave Unit 611
- 187 E Duncan St Unit 189
- 187-189 E Duncan St
- 2599 Medary Ave
- 2605 Medary Ave
- 2605 Medary Ave Unit 607
- 208 E Duncan St