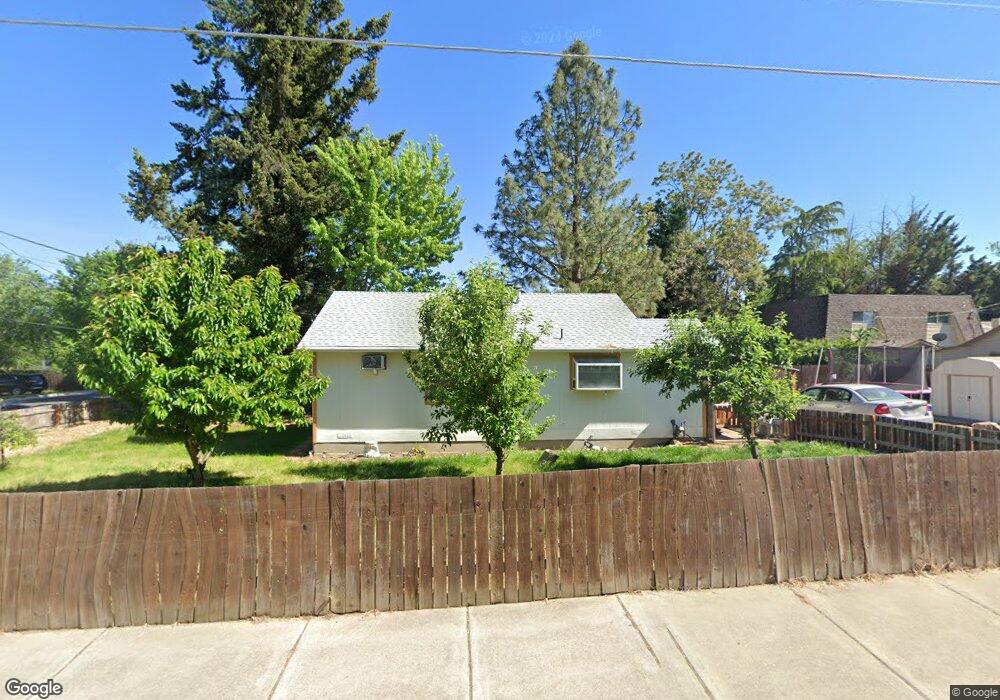
203 4th St Phoenix, OR 97535
Estimated Value: $207,669 - $300,000
2
Beds
1
Bath
660
Sq Ft
$379/Sq Ft
Est. Value
About This Home
This home is located at 203 4th St, Phoenix, OR 97535 and is currently estimated at $249,917, approximately $378 per square foot. 203 4th St is a home located in Jackson County with nearby schools including Phoenix Elementary School, Talent Middle School, and Phoenix High School.
Ownership History
Date
Name
Owned For
Owner Type
Purchase Details
Closed on
Jun 24, 2008
Sold by
Hsbc Bank Usa Na
Bought by
Hofmann Anona
Current Estimated Value
Home Financials for this Owner
Home Financials are based on the most recent Mortgage that was taken out on this home.
Original Mortgage
$90,000
Interest Rate
6.32%
Mortgage Type
Unknown
Purchase Details
Closed on
Jan 30, 2008
Sold by
Leach Donald and Leach Bonnie
Bought by
Hsbc Bank Usa Na and Ace Securities Corp Home Equity Loan Tr
Purchase Details
Closed on
Oct 30, 2000
Sold by
Brodeur & Brodeur Inc
Bought by
Leach Donald and Leach Bonnie
Create a Home Valuation Report for This Property
The Home Valuation Report is an in-depth analysis detailing your home's value as well as a comparison with similar homes in the area
Home Values in the Area
Average Home Value in this Area
Purchase History
| Date | Buyer | Sale Price | Title Company |
|---|---|---|---|
| Hofmann Anona | $70,000 | Fidelity Natl Title Co Of Or | |
| Hsbc Bank Usa Na | $141,360 | None Available | |
| Leach Donald | $65,000 | -- |
Source: Public Records
Mortgage History
| Date | Status | Borrower | Loan Amount |
|---|---|---|---|
| Previous Owner | Hofmann Anona | $90,000 |
Source: Public Records
Tax History
| Year | Tax Paid | Tax Assessment Tax Assessment Total Assessment is a certain percentage of the fair market value that is determined by local assessors to be the total taxable value of land and additions on the property. | Land | Improvement |
|---|---|---|---|---|
| 2026 | $1,578 | $98,930 | -- | -- |
| 2025 | $1,540 | $96,050 | $69,420 | $26,630 |
| 2024 | $1,540 | $93,260 | $67,410 | $25,850 |
| 2023 | $1,492 | $90,550 | $65,450 | $25,100 |
| 2022 | $1,453 | $90,550 | $65,450 | $25,100 |
| 2021 | $1,418 | $87,920 | $63,550 | $24,370 |
| 2020 | $1,373 | $85,360 | $61,700 | $23,660 |
| 2019 | $1,337 | $80,470 | $58,170 | $22,300 |
| 2018 | $1,298 | $78,130 | $56,480 | $21,650 |
| 2017 | $1,226 | $78,130 | $56,480 | $21,650 |
| 2016 | $1,193 | $73,660 | $53,250 | $20,410 |
| 2015 | $1,147 | $73,660 | $45,850 | $27,810 |
| 2014 | $1,103 | $69,440 | $43,230 | $26,210 |
Source: Public Records
Map
Nearby Homes
- 301 N Church St
- 316 W 3rd St
- 215 S C St
- 510 N Main St
- 600 N Main St
- 610 N Main St Unit 5A
- 612 N Main St
- 130 Rhonda Ln
- 130 Sharon Dr
- 3459 S Pacific Hwy
- 113 Houston Rd
- 300 Luman Rd Unit 197
- 300 Luman Rd Unit 200
- 921 N Rose St Unit A
- 4074 S Pacific Hwy Unit 10
- 4069 S Pacific Hwy Unit 108
- 4069 S Pacific Hwy Unit 42
- 4069 S Pacific Hwy Unit 103
- 817 Amerman Dr
- 113 Skyler Ln
Your Personal Tour Guide
Ask me questions while you tour the home.