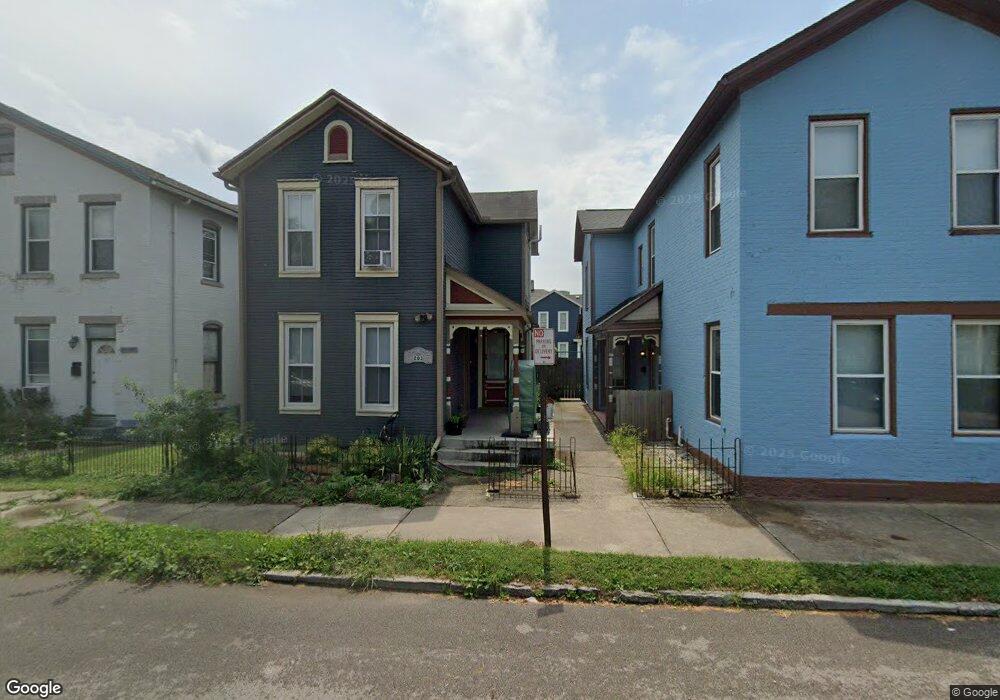
203 Alberta St Dayton, OH 45410
South Park NeighborhoodEstimated Value: $132,000 - $238,000
2
Beds
2
Baths
1,484
Sq Ft
$115/Sq Ft
Est. Value
About This Home
This home is located at 203 Alberta St, Dayton, OH 45410 and is currently estimated at $170,785, approximately $115 per square foot. 203 Alberta St is a home located in Montgomery County with nearby schools including Ruskin Elementary School, Kiser Elementary, and Emerson Academy.
Ownership History
Date
Name
Owned For
Owner Type
Purchase Details
Closed on
Jan 14, 2021
Sold by
Fischer Kara N
Bought by
Foster Ryan Matthew and Meeker Stewart Francis
Current Estimated Value
Home Financials for this Owner
Home Financials are based on the most recent Mortgage that was taken out on this home.
Original Mortgage
$136,000
Outstanding Balance
$121,359
Interest Rate
2.7%
Mortgage Type
New Conventional
Estimated Equity
$49,426
Purchase Details
Closed on
May 22, 2018
Sold by
The Home Group Llc
Bought by
Fischer Kara N
Home Financials for this Owner
Home Financials are based on the most recent Mortgage that was taken out on this home.
Original Mortgage
$145,825
Interest Rate
4.4%
Mortgage Type
New Conventional
Purchase Details
Closed on
Jul 29, 2014
Sold by
Schenck Harley and Montgomery County Treasurer
Bought by
City Of Dayton
Purchase Details
Closed on
Apr 6, 2006
Sold by
Schenck Brenda S and Schenck Harley
Bought by
Schenck Harley and Schenck Brenda S
Create a Home Valuation Report for This Property
The Home Valuation Report is an in-depth analysis detailing your home's value as well as a comparison with similar homes in the area
Home Values in the Area
Average Home Value in this Area
Purchase History
| Date | Buyer | Sale Price | Title Company |
|---|---|---|---|
| Foster Ryan Matthew | $170,000 | Landmark Ttl Agcy South Inc | |
| Fischer Kara N | $153,500 | Sterling Land Title Agency I | |
| City Of Dayton | -- | None Available | |
| Schenck Harley | -- | None Available |
Source: Public Records
Mortgage History
| Date | Status | Borrower | Loan Amount |
|---|---|---|---|
| Open | Foster Ryan Matthew | $136,000 | |
| Previous Owner | Fischer Kara N | $145,825 |
Source: Public Records
Tax History Compared to Growth
Tax History
| Year | Tax Paid | Tax Assessment Tax Assessment Total Assessment is a certain percentage of the fair market value that is determined by local assessors to be the total taxable value of land and additions on the property. | Land | Improvement |
|---|---|---|---|---|
| 2024 | $482 | $6,960 | $4,050 | $2,910 |
| 2023 | $482 | $6,960 | $4,050 | $2,910 |
| 2022 | $483 | $5,268 | $0 | $5,268 |
| 2021 | $481 | $5,268 | $0 | $5,268 |
| 2020 | $459 | $5,268 | $0 | $5,268 |
| 2019 | $513 | $5,268 | $0 | $5,268 |
| 2018 | $558 | $5,268 | $0 | $5,268 |
| 2017 | $608 | $6,060 | $3,810 | $2,250 |
| 2016 | $744 | $6,630 | $3,810 | $2,820 |
| 2015 | $1,003 | $6,630 | $3,810 | $2,820 |
| 2014 | $1,003 | $11,430 | $3,810 | $7,620 |
| 2012 | -- | $14,300 | $3,450 | $10,850 |
Source: Public Records
Map
Nearby Homes