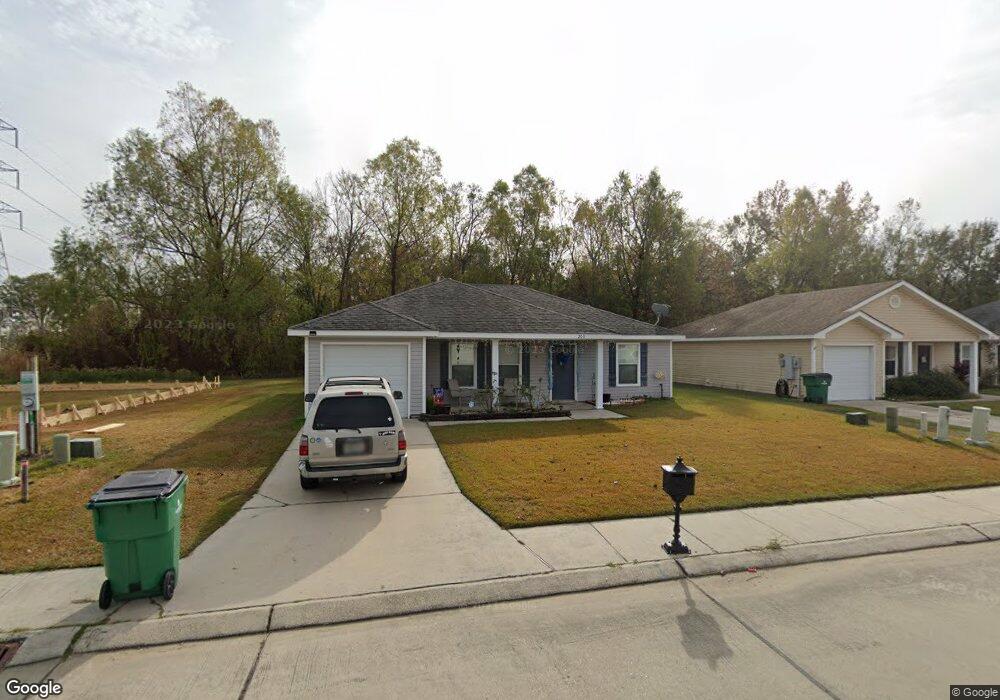
203 Allie Ln Luling, LA 70070
Estimated Value: $245,000 - $249,092
About This Home
This home is located at 203 Allie Ln, Luling, LA 70070 and is currently estimated at $247,273, approximately $201 per square foot. 203 Allie Ln is a home located in St. Charles Parish with nearby schools including Luling Elementary School, R.K. Smith Middle School, and Hahnville High School.
Ownership History
We collect this data history from publicly available records. To have your information removed, we recommend requesting removal directly through your county’s website.
Purchase Details
Purchase Details
Purchase Details
Home Financials for this Owner
Home Financials are based on the most recent Mortgage that was taken out on this home.Home Values in the Area
Average Home Value in this Area
Purchase History
We collect this data history from publicly available records. To have your information removed, we recommend requesting removal directly through your county’s website.
| Date | Buyer | Sale Price | Title Company |
|---|---|---|---|
| -- | None Listed On Document | ||
| -- | None Listed On Document | ||
| $152,000 | Choice Title |
Mortgage History
We collect this data history from publicly available records. To have your information removed, we recommend requesting removal directly through your county’s website.
| Date | Status | Borrower | Loan Amount |
|---|---|---|---|
| Previous Owner | $149,246 |
Tax History
We collect this data history from publicly available records. To have your information removed, we recommend requesting removal directly through your county’s website.
| Year | Tax Paid | Tax Assessment Tax Assessment Total Assessment is a certain percentage of the fair market value that is determined by local assessors to be the total taxable value of land and additions on the property. | Land | Improvement |
|---|---|---|---|---|
| 2025 | $1,310 | $20,460 | $3,310 | $17,150 |
| 2024 | $1,310 | $20,460 | $3,310 | $17,150 |
| 2023 | $1,330 | $15,568 | $3,310 | $12,258 |
| 2022 | $1,821 | $15,568 | $3,310 | $12,258 |
| 2021 | $1,522 | $12,908 | $2,979 | $9,929 |
| 2020 | $1,839 | $15,568 | $3,310 | $12,258 |
| 2019 | $1,625 | $13,704 | $2,120 | $11,584 |
| 2018 | $1,613 | $13,704 | $2,120 | $11,584 |
| 2017 | $1,611 | $13,704 | $2,120 | $11,584 |
| 2016 | $1,617 | $13,704 | $2,120 | $11,584 |
| 2015 | $730 | $13,704 | $2,120 | $11,584 |
| 2014 | $703 | $13,704 | $2,120 | $11,584 |
| 2013 | $705 | $13,704 | $2,120 | $11,584 |
Map
- 204 Allie Ln
- 206 Allie Ln
- 202 Allie Ln
- 203 Ashton Oaks Ln
- 205 Ashton Oaks Ln
- 208 Allie Ln
- 200 Allie Ln
- 205 Allie Ln
- 207 Ashton Oaks Ln
- 207 Allie Ln
- 210 Allie Ln
- 209 Allie Ln
- 201 Allie Ln
- 209 Ashton Oaks Ln
- 211 Allie Ln
- 212 Allie Ln
- 202 Ashton Oaks Ln
- 211 Ashton Oaks Ln
- 204 Ashton Oaks Ln
- 200 Ashton Oaks Ln
Ask me questions while you tour the home.