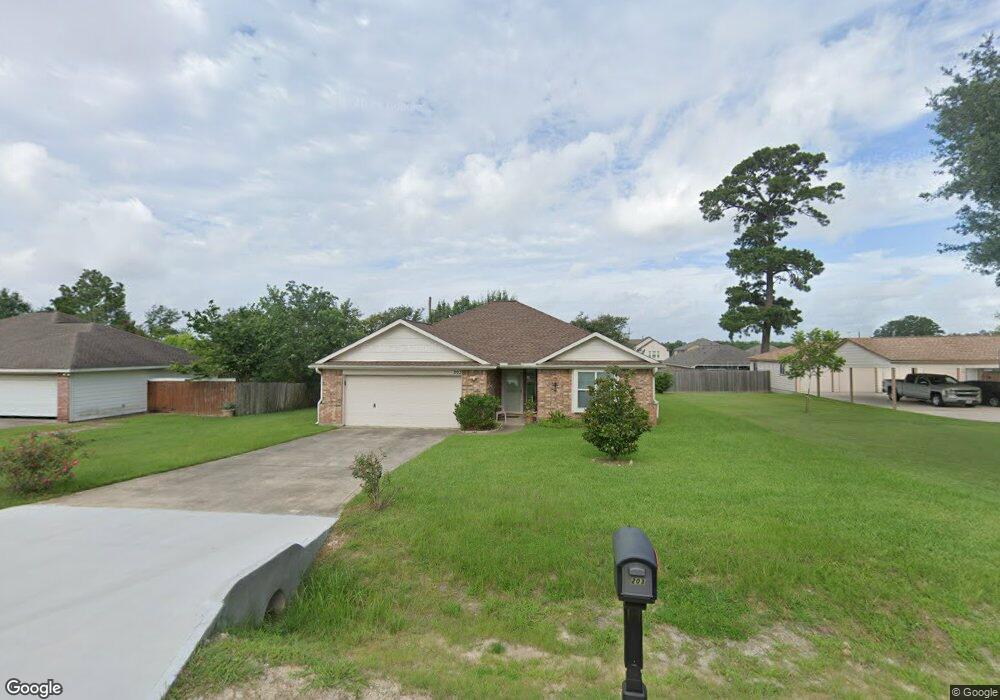
203 Amarillo Dr Magnolia, TX 77354
Estimated Value: $240,141 - $332,000
3
Beds
2
Baths
1,443
Sq Ft
$204/Sq Ft
Est. Value
About This Home
This home is located at 203 Amarillo Dr, Magnolia, TX 77354 and is currently estimated at $294,285, approximately $203 per square foot. 203 Amarillo Dr is a home located in Montgomery County with nearby schools including Willie E. Williams Elementary School, Magnolia Sixth Grade Campus, and Magnolia Junior High School.
Ownership History
Date
Name
Owned For
Owner Type
Purchase Details
Closed on
Jun 3, 2011
Sold by
Carpenter Janet Gwyn and Carter Laura Lee
Bought by
Whitman Carolyn M
Current Estimated Value
Purchase Details
Closed on
May 11, 2010
Sold by
Carter Laurene S
Bought by
Whitman Carolyn M
Purchase Details
Closed on
Oct 22, 2004
Sold by
Sizemore Sizemore B and Sizemore Jamie
Bought by
Whitman Carolyn M
Purchase Details
Closed on
Jul 16, 2003
Sold by
Kopecky James
Bought by
Sizemore B Keith and Sizemore Jamie D
Home Financials for this Owner
Home Financials are based on the most recent Mortgage that was taken out on this home.
Original Mortgage
$83,600
Interest Rate
7.87%
Mortgage Type
Purchase Money Mortgage
Purchase Details
Closed on
Jan 27, 2003
Sold by
Glenway Enterprises Inc
Bought by
Kopecky James
Purchase Details
Closed on
Jan 22, 2001
Sold by
State Bank
Bought by
Glenway Enterprises Inc
Create a Home Valuation Report for This Property
The Home Valuation Report is an in-depth analysis detailing your home's value as well as a comparison with similar homes in the area
Home Values in the Area
Average Home Value in this Area
Purchase History
| Date | Buyer | Sale Price | Title Company |
|---|---|---|---|
| Whitman Carolyn M | -- | None Available | |
| Whitman Carolyn M | -- | -- | |
| Whitman Carolyn M | -- | -- | |
| Sizemore B Keith | -- | South Land Title | |
| Kopecky James | -- | Chicago Title | |
| Glenway Enterprises Inc | -- | Alamo Title Company |
Source: Public Records
Mortgage History
| Date | Status | Borrower | Loan Amount |
|---|---|---|---|
| Previous Owner | Sizemore B Keith | $83,600 | |
| Closed | Sizemore B Keith | $20,900 |
Source: Public Records
Tax History Compared to Growth
Tax History
| Year | Tax Paid | Tax Assessment Tax Assessment Total Assessment is a certain percentage of the fair market value that is determined by local assessors to be the total taxable value of land and additions on the property. | Land | Improvement |
|---|---|---|---|---|
| 2025 | $1,000 | $259,146 | -- | -- |
| 2024 | $1,001 | $235,587 | -- | -- |
| 2023 | $1,001 | $214,170 | $36,720 | $191,940 |
| 2022 | $4,166 | $194,700 | $36,900 | $196,160 |
| 2021 | $4,007 | $177,000 | $27,540 | $149,460 |
| 2020 | $4,145 | $166,570 | $27,540 | $139,030 |
| 2019 | $3,936 | $158,630 | $27,540 | $131,090 |
| 2018 | $2,740 | $148,510 | $27,540 | $143,670 |
| 2017 | $3,488 | $135,010 | $11,020 | $143,670 |
| 2016 | $3,171 | $122,740 | $11,020 | $122,170 |
| 2015 | $1,525 | $111,580 | $11,020 | $119,230 |
| 2014 | $1,525 | $101,440 | $11,020 | $103,790 |
Source: Public Records
Map
Nearby Homes
- 212 Harlingen Dr
- 232 Harlingen Dr
- The Trinity E Plan at Windmill Estates
- The Colorado F Plan at Windmill Estates
- The Brazos E Plan at Windmill Estates
- The Sequoia A Plan at Windmill Estates
- The Tierra A Plan at Windmill Estates
- The Laguna A Plan at Windmill Estates
- The Comal F Plan at Windmill Estates
- The Blanco E Plan at Windmill Estates
- The Blanco F Plan at Windmill Estates
- The Frio F Plan at Windmill Estates
- The Riviera A Plan at Windmill Estates
- The Sabine E Plan at Windmill Estates
- The Acadia A Plan at Windmill Estates
- The San Marcos E Plan at Windmill Estates
- 244 Harlingen Dr
- 231 Corpus Dr
- 248 Harlingen Dr
- 303 Beaumont Dr
- 137 Amarillo Dr
- 139 Amarillo Dr
- 207 Amarillo Dr
- 135 Amarillo Dr
- 202 Amarillo Dr
- 206 Amarillo Dr
- 138 Amarillo Dr
- 217 Amarillo Dr
- 00 Fm 1774
- 214 Amarillo Dr
- 26 Amarillo Dr
- 25 Amarillo Dr
- 0 Amarillo Dr
- 10&11 Amarillo Dr
- 211 Corpus Dr
- 203 Corpus Dr
- 215 Corpus Dr
- 201 Harlingen Dr Unit 38264760
- 201 Harlingen Dr Unit 36611458
- 223 Amarillo Dr