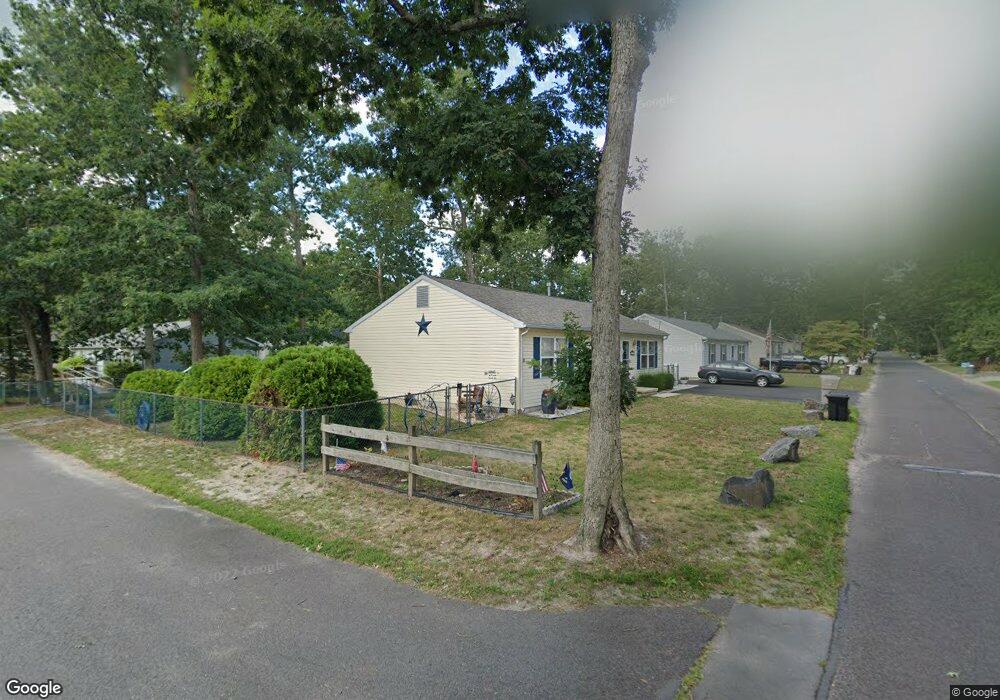
203 Bayberry St Browns Mills, NJ 08015
Estimated Value: $293,810 - $351,000
--
Bed
--
Bath
1,260
Sq Ft
$261/Sq Ft
Est. Value
About This Home
This home is located at 203 Bayberry St, Browns Mills, NJ 08015 and is currently estimated at $329,203, approximately $261 per square foot. 203 Bayberry St is a home located in Burlington County.
Ownership History
Date
Name
Owned For
Owner Type
Purchase Details
Closed on
Aug 17, 2004
Sold by
Askew Mickey W
Bought by
Heyer John and Heyer Teresa
Current Estimated Value
Home Financials for this Owner
Home Financials are based on the most recent Mortgage that was taken out on this home.
Original Mortgage
$167,400
Interest Rate
5.71%
Mortgage Type
VA
Purchase Details
Closed on
Jan 30, 1998
Sold by
Pineland Builders Inc
Bought by
Askew Mickey W
Home Financials for this Owner
Home Financials are based on the most recent Mortgage that was taken out on this home.
Original Mortgage
$92,597
Interest Rate
6.95%
Mortgage Type
VA
Create a Home Valuation Report for This Property
The Home Valuation Report is an in-depth analysis detailing your home's value as well as a comparison with similar homes in the area
Home Values in the Area
Average Home Value in this Area
Purchase History
| Date | Buyer | Sale Price | Title Company |
|---|---|---|---|
| Heyer John | $163,800 | -- | |
| Askew Mickey W | $89,900 | Congress Title Corp |
Source: Public Records
Mortgage History
| Date | Status | Borrower | Loan Amount |
|---|---|---|---|
| Previous Owner | Heyer John | $167,400 | |
| Previous Owner | Askew Mickey W | $92,597 |
Source: Public Records
Tax History Compared to Growth
Tax History
| Year | Tax Paid | Tax Assessment Tax Assessment Total Assessment is a certain percentage of the fair market value that is determined by local assessors to be the total taxable value of land and additions on the property. | Land | Improvement |
|---|---|---|---|---|
| 2025 | $4,619 | $150,700 | $38,000 | $112,700 |
| 2024 | $4,334 | $150,700 | $38,000 | $112,700 |
| 2023 | $4,334 | $150,700 | $38,000 | $112,700 |
| 2022 | $4,012 | $150,700 | $38,000 | $112,700 |
| 2021 | $3,600 | $150,700 | $38,000 | $112,700 |
| 2020 | $3,703 | $150,700 | $38,000 | $112,700 |
| 2019 | $3,546 | $150,700 | $38,000 | $112,700 |
| 2018 | $3,425 | $150,700 | $38,000 | $112,700 |
| 2017 | $3,355 | $150,700 | $38,000 | $112,700 |
| 2016 | $3,301 | $88,300 | $19,600 | $68,700 |
| 2015 | $3,274 | $88,300 | $19,600 | $68,700 |
| 2014 | $3,130 | $88,300 | $19,600 | $68,700 |
Source: Public Records
Map
Nearby Homes