203 Beedie Jones Rd Chatsworth, GA 30705
Estimated Value: $185,844 - $249,000
--
Bed
2
Baths
1,232
Sq Ft
$174/Sq Ft
Est. Value
About This Home
This home is located at 203 Beedie Jones Rd, Chatsworth, GA 30705 and is currently estimated at $214,211, approximately $173 per square foot. 203 Beedie Jones Rd is a home located in Murray County with nearby schools including Woodlawn Elementary School, Bagley Middle School, and North Murray High School.
Ownership History
Date
Name
Owned For
Owner Type
Purchase Details
Closed on
Sep 2, 2017
Sold by
Elsberry James W
Bought by
Elsberry David and Witherow Sandra
Current Estimated Value
Create a Home Valuation Report for This Property
The Home Valuation Report is an in-depth analysis detailing your home's value as well as a comparison with similar homes in the area
Home Values in the Area
Average Home Value in this Area
Purchase History
| Date | Buyer | Sale Price | Title Company |
|---|---|---|---|
| Elsberry David | -- | -- |
Source: Public Records
Tax History Compared to Growth
Tax History
| Year | Tax Paid | Tax Assessment Tax Assessment Total Assessment is a certain percentage of the fair market value that is determined by local assessors to be the total taxable value of land and additions on the property. | Land | Improvement |
|---|---|---|---|---|
| 2024 | $171 | $66,432 | $3,360 | $63,072 |
| 2023 | $176 | $69,548 | $3,360 | $66,188 |
| 2022 | $176 | $60,068 | $3,200 | $56,868 |
| 2021 | $189 | $48,348 | $3,200 | $45,148 |
| 2020 | $189 | $40,068 | $3,080 | $36,988 |
| 2019 | $191 | $40,068 | $3,080 | $36,988 |
| 2018 | $191 | $41,748 | $3,080 | $38,668 |
| 2017 | $0 | $35,908 | $2,200 | $33,708 |
| 2016 | $144 | $33,336 | $7,200 | $26,136 |
| 2015 | -- | $33,336 | $7,200 | $26,136 |
| 2014 | -- | $33,336 | $7,200 | $26,136 |
| 2013 | -- | $33,336 | $7,200 | $26,136 |
Source: Public Records
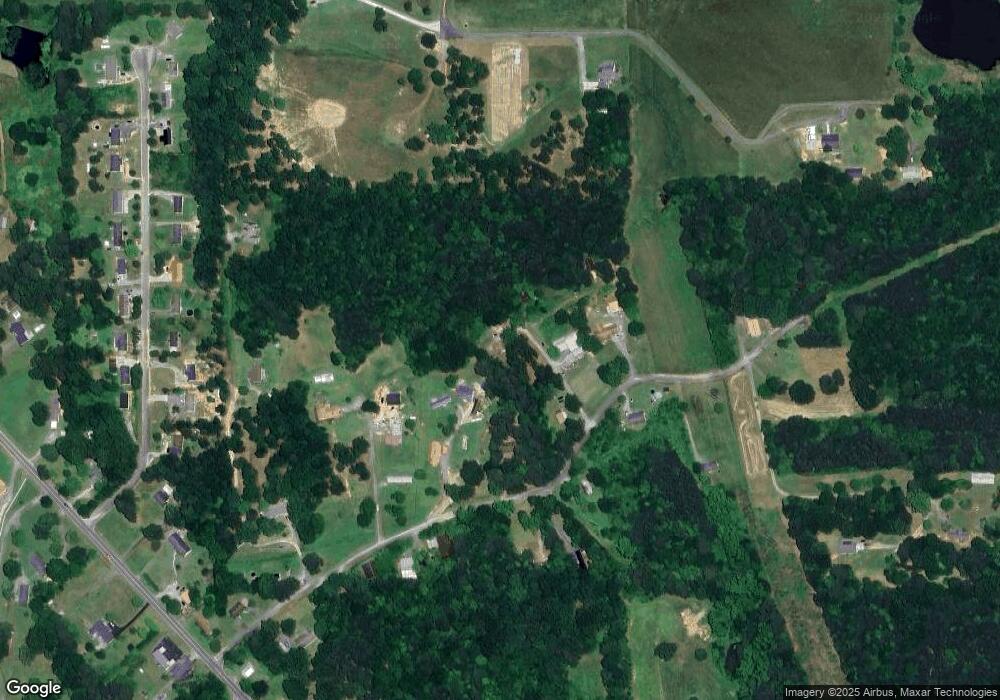
Map
Nearby Homes
- 3807 Georgia 52
- 247 Robert Jackson Rd
- 0 Hwy 52 Alt Unit 121627
- 543 Callie Jones Rd
- 0 Old Free Hope Rd
- 0 Highway 225 S Unit 7662590
- 0 Highway 225 S Unit 9659
- 00 Highway 225 S
- 600 Tibbs Bridge Rd
- 117 Indian Trace
- 184 Indian Trace
- 00 Indian Trace
- 135 Hillcrest Dr
- 23 Brandon Ln
- 00 Tipi Ln
- 0 Leon Cir
- 51 Corvette Dr
- 63 Daisy Ln
- 156 Goldsmith Ln
- 1379 Highway 225 S
- 309 Beedie Jones Rd
- 4969 Highway 52a
- 4985 Highway 52a
- 159 Beedie Jones Rd
- 133 Beedie Jones Rd
- 248 Beedie Jones Rd
- 123 Beedie Jones Rd
- 112 Beedie Jones Rd
- 399 Beedie Jones Rd
- 63 Beedie Jones Rd
- 71 Beedie Jones Rd
- 775 Robert Jackson Rd
- 126 Rolling Hills Rd
- 106 Rolling Hills Rd
- 84 Rolling Hills Rd
- 166 Rolling Hills Rd
- 144 Rolling Hills Rd
- 186 Rolling Hills Rd
- 60 Rolling Hills Rd
- 52 Beedie Jones Rd