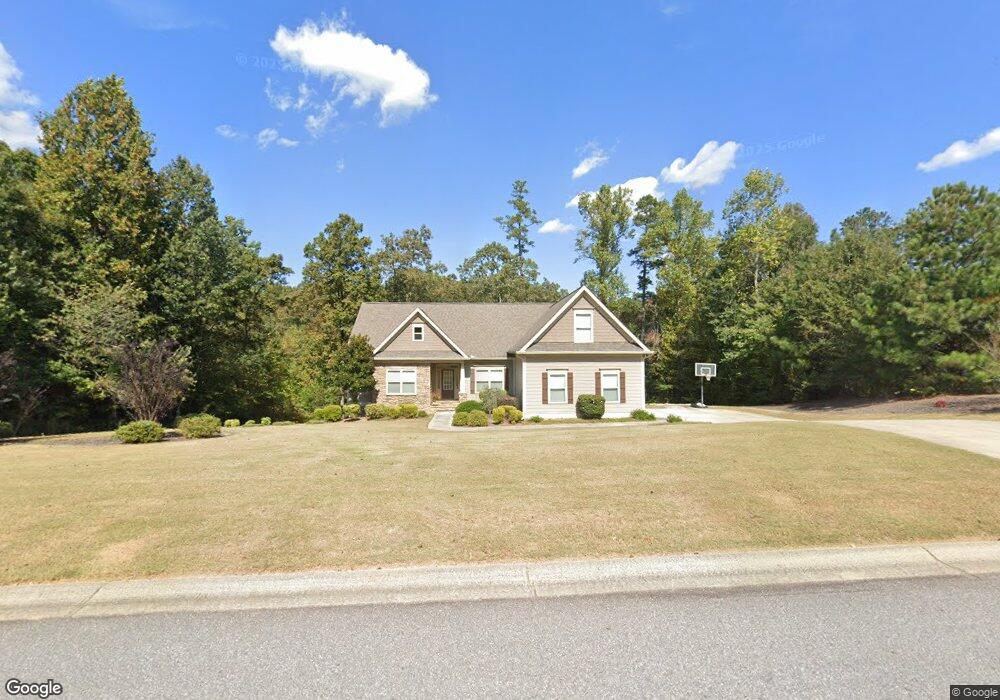
203 Canyon Ct Unit 30 Winder, GA 30680
Estimated Value: $412,463 - $477,000
3
Beds
3
Baths
1,980
Sq Ft
$226/Sq Ft
Est. Value
About This Home
This home is located at 203 Canyon Ct Unit 30, Winder, GA 30680 and is currently estimated at $446,866, approximately $225 per square foot. 203 Canyon Ct Unit 30 is a home located in Barrow County with nearby schools including County Line Elementary School, Russell Middle School, and Winder-Barrow High School.
Ownership History
Date
Name
Owned For
Owner Type
Purchase Details
Closed on
Apr 15, 2016
Sold by
Sosebee Properties Inc
Bought by
Queen Ellery E and Queen Martha F
Current Estimated Value
Home Financials for this Owner
Home Financials are based on the most recent Mortgage that was taken out on this home.
Original Mortgage
$185,925
Outstanding Balance
$147,948
Interest Rate
3.73%
Mortgage Type
New Conventional
Estimated Equity
$298,918
Purchase Details
Closed on
Jun 19, 2014
Sold by
Reo Funding Solutions Iii Llc
Bought by
Sosebee Properties Inc
Purchase Details
Closed on
Sep 12, 2012
Sold by
The Brand Banking Co
Bought by
Reo Funding Solutions Iii Llc
Purchase Details
Closed on
May 6, 2008
Sold by
Epicurus Investments Llc
Bought by
Brand Banking Company The
Purchase Details
Closed on
Jan 14, 2005
Sold by
Ripp Star Development Llc
Bought by
Epicurus Investments Llc
Purchase Details
Closed on
Aug 15, 2003
Bought by
Ripp Star Development Llc
Create a Home Valuation Report for This Property
The Home Valuation Report is an in-depth analysis detailing your home's value as well as a comparison with similar homes in the area
Home Values in the Area
Average Home Value in this Area
Purchase History
| Date | Buyer | Sale Price | Title Company |
|---|---|---|---|
| Queen Ellery E | $247,900 | -- | |
| Sosebee Properties Inc | $12,000 | -- | |
| Reo Funding Solutions Iii Llc | $10,000 | -- | |
| Brand Banking Company The | -- | -- | |
| Epicurus Investments Llc | $42,000 | -- | |
| Ripp Star Development Llc | -- | -- |
Source: Public Records
Mortgage History
| Date | Status | Borrower | Loan Amount |
|---|---|---|---|
| Open | Queen Ellery E | $185,925 |
Source: Public Records
Tax History Compared to Growth
Tax History
| Year | Tax Paid | Tax Assessment Tax Assessment Total Assessment is a certain percentage of the fair market value that is determined by local assessors to be the total taxable value of land and additions on the property. | Land | Improvement |
|---|---|---|---|---|
| 2024 | $3,746 | $148,714 | $29,600 | $119,114 |
| 2023 | $3,750 | $149,314 | $29,600 | $119,714 |
| 2022 | $3,827 | $131,489 | $29,600 | $101,889 |
| 2021 | $3,249 | $104,483 | $17,600 | $86,883 |
| 2020 | $3,031 | $96,980 | $17,600 | $79,380 |
| 2019 | $3,084 | $96,980 | $17,600 | $79,380 |
| 2018 | $2,986 | $94,652 | $17,600 | $77,052 |
| 2017 | $2,480 | $85,165 | $17,600 | $67,565 |
| 2016 | $2,288 | $72,294 | $17,600 | $54,694 |
| 2015 | $545 | $27,200 | $17,600 | $9,600 |
| 2014 | $241 | $4,805 | $4,805 | $0 |
| 2013 | -- | $4,804 | $4,804 | $0 |
Source: Public Records
Map
Nearby Homes
- 137 New Cut Rd
- 731 Lincoln Dr
- The Paisley Plan at Rockwell Farms
- The Rockwell Plan at Rockwell Farms
- The Barnes Plan at Rockwell Farms
- The Reynolds Plan at Rockwell Farms
- The Austin Plan at Rockwell Farms
- The Logan Plan at Rockwell Farms
- The Rose II Plan at Rockwell Farms
- 2858 Shadowstone Way
- 1686 Shadowstone Ct
- 1557 Shadowstone Cir
- 1931 Windstone Place
- 1929 Windstone Place
- 615 Wellington Dr
- 2839 Shadowstone Way
- 432 Mulberry Rd
- 1303 Windstone Ct
- 99 Mcmillian Ct
- 72 Mcmillian Ct
- 203 Canyon Ct
- 126 New Cut Rd
- 0 New Cut Rd Unit 7494590
- 0 New Cut Rd Unit 7453491
- 0 New Cut Rd Unit 2704825
- 0 New Cut Rd Unit 8692118
- 0 New Cut Rd Unit 7618377
- 0 New Cut Rd Unit 7333991
- 0 New Cut Rd Unit 8915170
- 0 New Cut Rd Unit 3124227
- 132 New Cut Rd
- 0 Canyon Ct Unit 8177324
- 0 Canyon Ct Unit 2966655
- 0 Canyon Ct Unit 7515892
- 205 Canyon Ct
- 122 New Cut Rd
- 202 Canyon Ct Unit 40
- 202 Canyon Ct
- 201 Canyon Ct
- 121 New Cut Rd