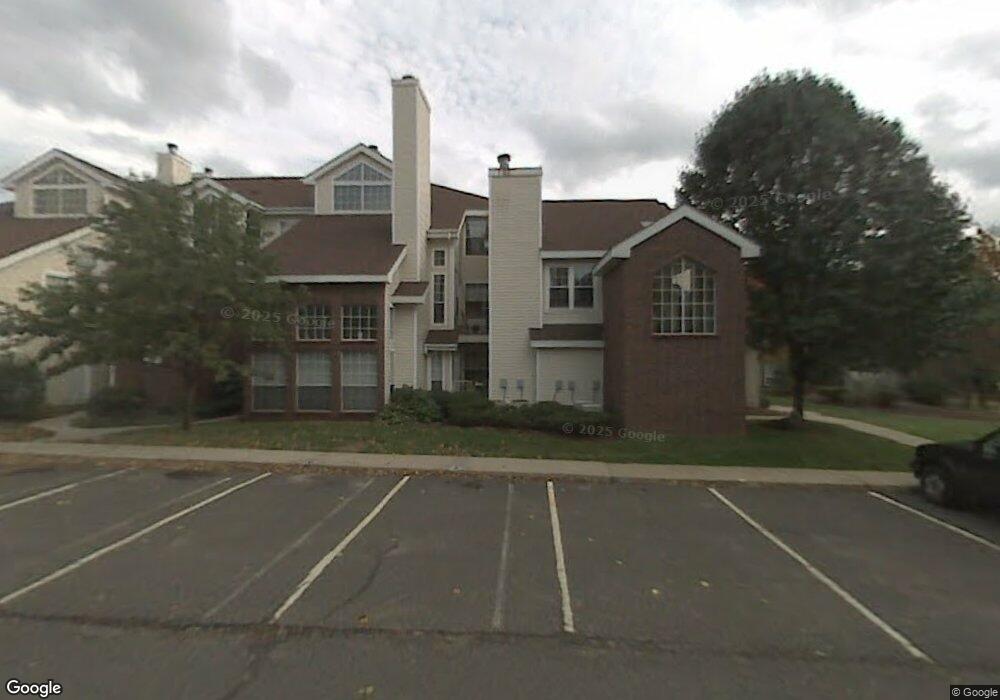
203 Carriage Crossing Ln Middletown, CT 06457
Westfield NeighborhoodEstimated Value: $151,105 - $178,000
1
Bed
1
Bath
670
Sq Ft
$252/Sq Ft
Est. Value
About This Home
This home is located at 203 Carriage Crossing Ln, Middletown, CT 06457 and is currently estimated at $168,776, approximately $251 per square foot. 203 Carriage Crossing Ln is a home located in Middlesex County with nearby schools including Moody School.
Ownership History
Date
Name
Owned For
Owner Type
Purchase Details
Closed on
Jul 26, 2021
Sold by
Santoro Matthew L
Bought by
Matthew Santoro Ret
Current Estimated Value
Purchase Details
Closed on
Dec 16, 2013
Sold by
Department Of Housing & Urban Dev
Bought by
Santoro 3Rd Matthew L
Home Financials for this Owner
Home Financials are based on the most recent Mortgage that was taken out on this home.
Original Mortgage
$58,400
Interest Rate
4.14%
Purchase Details
Closed on
Aug 15, 2013
Sold by
Us Bank Na
Bought by
Department Of Housing & Urban Dev
Purchase Details
Closed on
Apr 26, 2006
Sold by
Brunetti Ann C
Bought by
Twining Lillian
Home Financials for this Owner
Home Financials are based on the most recent Mortgage that was taken out on this home.
Original Mortgage
$113,172
Interest Rate
6.4%
Create a Home Valuation Report for This Property
The Home Valuation Report is an in-depth analysis detailing your home's value as well as a comparison with similar homes in the area
Home Values in the Area
Average Home Value in this Area
Purchase History
| Date | Buyer | Sale Price | Title Company |
|---|---|---|---|
| Matthew Santoro Ret | -- | None Available | |
| Santoro 3Rd Matthew L | $73,000 | -- | |
| Department Of Housing & Urban Dev | -- | -- | |
| Twining Lillian | $115,000 | -- |
Source: Public Records
Mortgage History
| Date | Status | Borrower | Loan Amount |
|---|---|---|---|
| Previous Owner | Santoro 3Rd Matthew L | $58,400 | |
| Previous Owner | Twining Lillian | $113,172 |
Source: Public Records
Tax History Compared to Growth
Tax History
| Year | Tax Paid | Tax Assessment Tax Assessment Total Assessment is a certain percentage of the fair market value that is determined by local assessors to be the total taxable value of land and additions on the property. | Land | Improvement |
|---|---|---|---|---|
| 2025 | $2,204 | $65,440 | $0 | $65,440 |
| 2024 | $2,090 | $65,440 | $0 | $65,440 |
| 2023 | $1,966 | $65,440 | $0 | $65,440 |
| 2022 | $1,759 | $46,880 | $0 | $46,880 |
| 2021 | $1,755 | $46,880 | $0 | $46,880 |
| 2020 | $1,757 | $46,880 | $0 | $46,880 |
| 2019 | $1,767 | $46,880 | $0 | $46,880 |
| 2018 | $1,704 | $46,880 | $0 | $46,880 |
| 2017 | $2,247 | $63,390 | $0 | $63,390 |
| 2016 | $2,204 | $63,390 | $0 | $63,390 |
| 2015 | $2,156 | $63,390 | $0 | $63,390 |
| 2014 | $2,157 | $63,390 | $0 | $63,390 |
Source: Public Records
Map
Nearby Homes
- 130 Carriage Crossing Ln Unit 130
- 48 Carriage Crossing Ln Unit 8108
- 7 W Meadow Ln Unit 5
- 67 Braeburn Ln
- 7 Inverness Square
- 59 Inverness Ln
- 59 Fieldbrook Rd
- 886 East St
- 14 Rising Trail Dr
- 52 Rising Trail Dr
- 36 Rising Trail Dr Unit 36
- 100 Rising Trail Dr Unit 100
- 162 Rising Trail Dr
- 17 Flynn Ln
- 123 Burgundy Hill Ln
- 36 Burgundy Hill Ln
- 48 Burgundy Hill Ln Unit 48
- 56 Burgundy Hill Ln Unit 56
- 38 Burgundy Hill Ln
- 229 Burgundy Hill Ln Unit 229
- 207 Carriage Crossing Ln
- 207 Carriage Crossing Ln Unit 207
- 206 Carriage Crossing Ln
- 206 Carriage Crossing Ln Unit 206
- 208 Carriage Crossing Ln
- 208 Carriage Crossing Ln Unit 208
- 205 Carriage Crossing Ln
- 204 Carriage Crossing Ln
- 204 Carriage Crossing Ln Unit 350
- 204 Carriage Crossing Ln Unit 204
- 203 Carriage Crossing Ln Unit 203
- 209 Carriage Crossing Ln
- 209 Carriage Crossing Ln Unit 209
- 201 Carriage Crossing Ln
- 210 Carriage Crossing Ln
- 210 Carriage Crossing Ln Unit 210
- 200 Carriage Crossing Ln
- 211 Carriage Crossing Ln
- 199 Carriage Crossing Ln
- 212 Carriage Crossing Ln