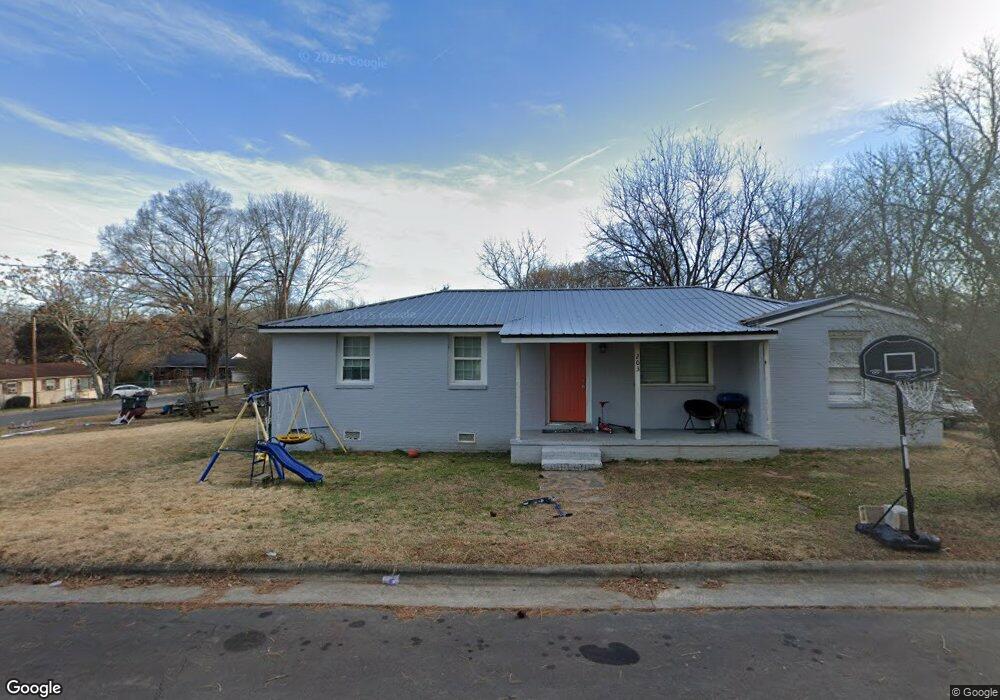
203 Chelsea Dr Oxford, NC 27565
Estimated Value: $91,000 - $250,000
--
Bed
1
Bath
1,260
Sq Ft
$121/Sq Ft
Est. Value
About This Home
This home is located at 203 Chelsea Dr, Oxford, NC 27565 and is currently estimated at $152,333, approximately $120 per square foot. 203 Chelsea Dr is a home located in Granville County with nearby schools including Stovall-Shaw Elementary School, Northern Granville Middle School, and Granville Central High School.
Ownership History
Date
Name
Owned For
Owner Type
Purchase Details
Closed on
Jun 14, 2021
Sold by
Forward Moving Investments Llc
Bought by
Forward Moviing Investments Llc
Current Estimated Value
Home Financials for this Owner
Home Financials are based on the most recent Mortgage that was taken out on this home.
Original Mortgage
$280,500
Outstanding Balance
$253,958
Interest Rate
2.9%
Mortgage Type
Commercial
Estimated Equity
-$101,625
Purchase Details
Closed on
May 18, 2020
Sold by
Vasquez Dionias A Cabrera and Cabrera Yaniva Chavez
Bought by
Forward Moving Investments Llc
Purchase Details
Closed on
Jun 7, 2017
Sold by
Bynum Leonnetta P and Bynum Nathaniel
Bought by
Vasquez Dionias A Cabrera and Cabrera Yaniva Chavez
Purchase Details
Closed on
Aug 30, 2007
Sold by
Mcmillon Leonnetta Y
Bought by
Mcmillon Leonnetta Y
Purchase Details
Closed on
Aug 27, 2007
Sold by
Platt Leonard
Bought by
Mcmillon Leonnetta P
Create a Home Valuation Report for This Property
The Home Valuation Report is an in-depth analysis detailing your home's value as well as a comparison with similar homes in the area
Home Values in the Area
Average Home Value in this Area
Purchase History
| Date | Buyer | Sale Price | Title Company |
|---|---|---|---|
| Forward Moviing Investments Llc | -- | None Available | |
| Forward Moving Investments Llc | $50,000 | None Available | |
| Vasquez Dionias A Cabrera | $5,000 | None Available | |
| Mcmillon Leonnetta Y | -- | -- | |
| Mcmillon Leonnetta P | -- | -- |
Source: Public Records
Mortgage History
| Date | Status | Borrower | Loan Amount |
|---|---|---|---|
| Open | Forward Moviing Investments Llc | $280,500 |
Source: Public Records
Tax History Compared to Growth
Tax History
| Year | Tax Paid | Tax Assessment Tax Assessment Total Assessment is a certain percentage of the fair market value that is determined by local assessors to be the total taxable value of land and additions on the property. | Land | Improvement |
|---|---|---|---|---|
| 2025 | $301 | $22,075 | $7,500 | $14,575 |
| 2024 | $301 | $22,075 | $7,500 | $14,575 |
| 2023 | $299 | $16,231 | $6,000 | $10,231 |
| 2022 | $265 | $16,231 | $6,000 | $10,231 |
| 2021 | $260 | $16,231 | $6,000 | $10,231 |
| 2020 | $260 | $16,231 | $6,000 | $10,231 |
| 2019 | $260 | $16,231 | $6,000 | $10,231 |
| 2018 | $260 | $16,231 | $6,000 | $10,231 |
| 2016 | $816 | $52,348 | $6,000 | $46,348 |
| 2015 | $784 | $52,348 | $6,000 | $46,348 |
| 2014 | $785 | $52,348 | $6,000 | $46,348 |
| 2013 | -- | $52,348 | $6,000 | $46,348 |
Source: Public Records
Map
Nearby Homes
- 106 Summitt Ave
- 211 Wilmington Ave
- 617 Raleigh St
- 608 Raleigh St
- 107 Flue Ct
- 104 Flue Ct
- 101 Flue Ct
- 504 Henderson St
- 504 Rhino Bend
- 100 Flue Ct
- 111 Rhino Bend
- 102 Cultivar St
- 501 Raleigh St
- 103 Scoville St
- 501 Benton Dr
- 201 Benton Dr
- Blanco Plan at The Meadows at Oxford
- Carolina Plan at The Meadows at Oxford
- Burke Plan at The Meadows at Oxford
- Camden Plan at The Meadows at Oxford