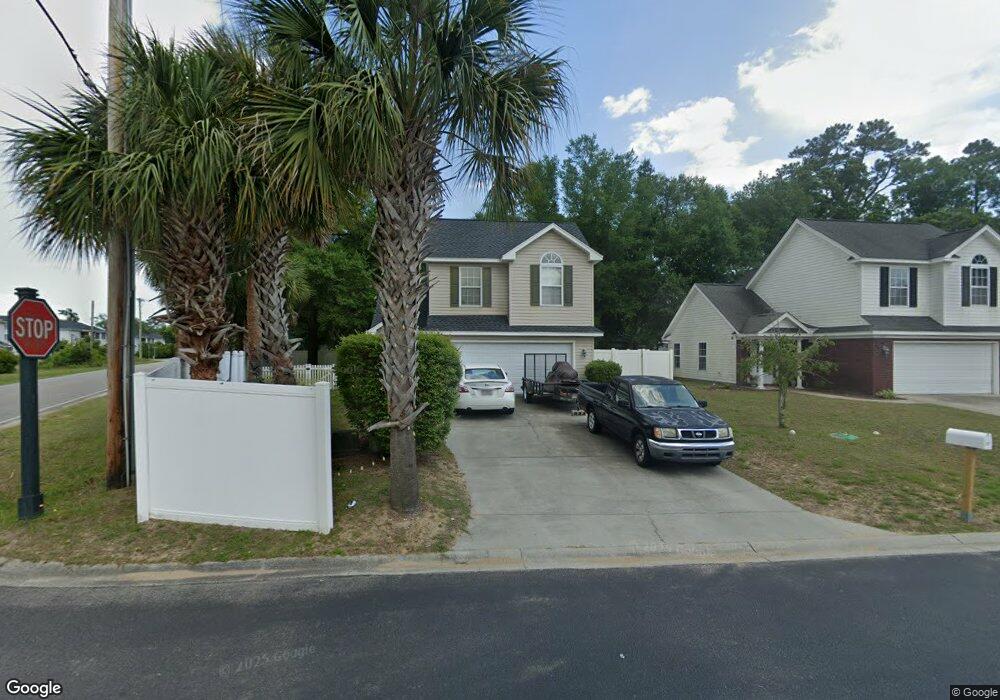
203 Chesapeake Ln Murrells Inlet, SC 29576
Estimated Value: $360,000 - $390,259
3
Beds
3
Baths
1,900
Sq Ft
$196/Sq Ft
Est. Value
About This Home
This home is located at 203 Chesapeake Ln, Murrells Inlet, SC 29576 and is currently estimated at $373,315, approximately $196 per square foot. 203 Chesapeake Ln is a home located in Georgetown County with nearby schools including Waccamaw Elementary School, Waccamaw Intermediate School, and Waccamaw Middle School.
Ownership History
Date
Name
Owned For
Owner Type
Purchase Details
Closed on
Jul 22, 2011
Sold by
Federal National Mortgage Association
Bought by
Campbell Debbie S and Sobetsky Benjamin
Current Estimated Value
Home Financials for this Owner
Home Financials are based on the most recent Mortgage that was taken out on this home.
Original Mortgage
$128,653
Outstanding Balance
$87,415
Interest Rate
4.25%
Mortgage Type
FHA
Estimated Equity
$285,900
Purchase Details
Closed on
Nov 22, 2010
Sold by
Johnson Carey D
Bought by
Federal National Mortgage Association
Purchase Details
Closed on
May 8, 2007
Sold by
Inlet Palms Llc
Bought by
Johnson Carey D
Home Financials for this Owner
Home Financials are based on the most recent Mortgage that was taken out on this home.
Original Mortgage
$176,000
Interest Rate
6.17%
Mortgage Type
Purchase Money Mortgage
Create a Home Valuation Report for This Property
The Home Valuation Report is an in-depth analysis detailing your home's value as well as a comparison with similar homes in the area
Home Values in the Area
Average Home Value in this Area
Purchase History
| Date | Buyer | Sale Price | Title Company |
|---|---|---|---|
| Campbell Debbie S | $132,000 | -- | |
| Federal National Mortgage Association | $85,000 | -- | |
| Johnson Carey D | $243,000 | None Available |
Source: Public Records
Mortgage History
| Date | Status | Borrower | Loan Amount |
|---|---|---|---|
| Open | Campbell Debbie S | $128,653 | |
| Previous Owner | Johnson Carey D | $176,000 |
Source: Public Records
Tax History Compared to Growth
Tax History
| Year | Tax Paid | Tax Assessment Tax Assessment Total Assessment is a certain percentage of the fair market value that is determined by local assessors to be the total taxable value of land and additions on the property. | Land | Improvement |
|---|---|---|---|---|
| 2024 | $1,278 | $8,560 | $2,000 | $6,560 |
| 2023 | $1,278 | $8,560 | $2,000 | $6,560 |
| 2022 | $1,077 | $8,560 | $2,000 | $6,560 |
| 2021 | $1,044 | $8,556 | $2,000 | $6,556 |
| 2020 | $1,041 | $8,556 | $2,000 | $6,556 |
| 2019 | $1,059 | $8,768 | $2,000 | $6,768 |
| 2018 | $1,086 | $87,680 | $0 | $0 |
| 2017 | $919 | $87,720 | $0 | $0 |
| 2016 | $910 | $8,772 | $0 | $0 |
| 2015 | $927 | $0 | $0 | $0 |
| 2014 | $927 | $218,700 | $50,000 | $168,700 |
| 2012 | -- | $218,700 | $50,000 | $168,700 |
Source: Public Records
Map
Nearby Homes
- 211 Chesapeake Ln
- 613 Fairgrass Ct Unit 35E
- 416 Fountain Grass Ct Unit 6E
- 404 Fountain Grass Ct Unit 6B
- 400 Fountain Grass Ct Unit 6A
- 412 Fountain Grass Ct Unit 6D
- 408 Fountain Grass Ct Unit 6C
- 385 Grove Park Loop
- 853 Wachesaw Rd
- 894 S Marlin Cir
- 835 S Marlin Cir
- 50 Turning Stone Blvd Unit 5
- 50 Turning Stone Blvd Unit 7
- 1021 S Marlin Cir
- 400 Wagon Wheel Loop Unit Lot 29
- 4841 Moss Creek Loop Unit 41
- 827 White Sand Ct
- 62 Sea Shell Dr Unit 62
- 184 Sea Shell Dr Unit 12
- 58 Fathom Ln
- 207 Chesapeake Ln
- 206 Chesapeake Ln
- 210 Chesapeake Ln
- 215 Chesapeake Ln Unit Inlet Palms
- 215 Chesapeake Ln
- 4653 Wesley Rd
- 219 Chesapeake Ln
- Lot 13 Chesapeake Ln Unit Inlet Palms
- Lot 6 Chesapeake Ln Unit Inlet Palms
- Lot 9 Chesapeake Ln Unit Inlet Palms
- Lot 5 Chesapeake Ln Unit Inlet Palms
- 4643 Wesley Rd
- 223 Chesapeake Ln
- 4576 Sandy Ln
- 822 Sandy Ln
- 226 Chesapeake Ln
- 226 Chesapeake Ln Unit Inlet Palms
- 870 Nandina Dr
- 4725 Wesley Rd
- 227 Chesapeake Ln