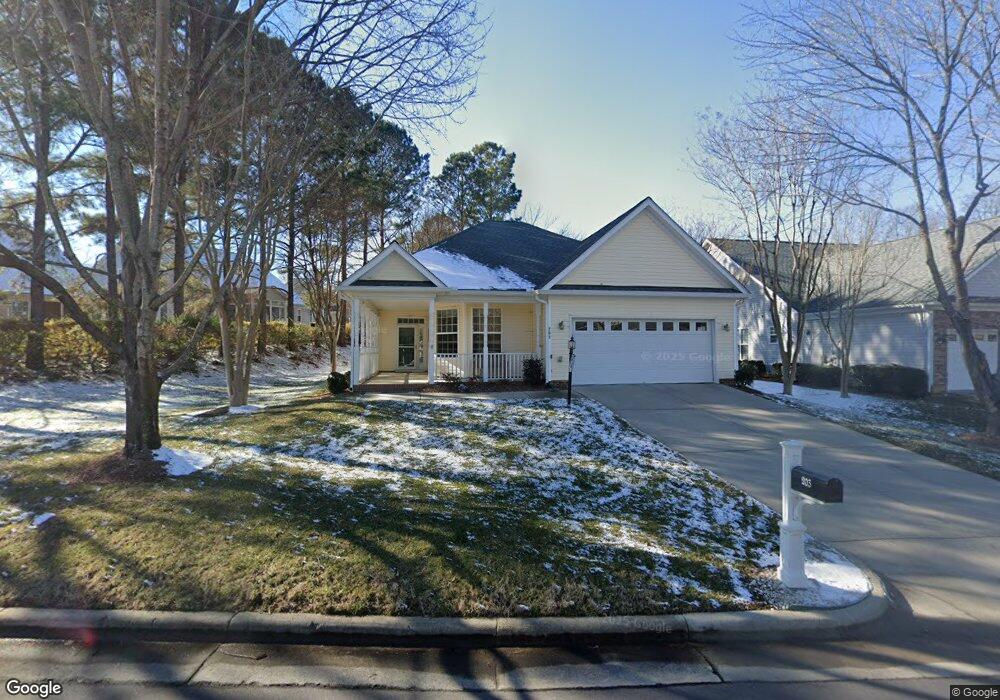
203 Crystal Brook Ln Cary, NC 27519
West Cary NeighborhoodEstimated Value: $537,000 - $575,000
3
Beds
2
Baths
1,684
Sq Ft
$330/Sq Ft
Est. Value
About This Home
This home is located at 203 Crystal Brook Ln, Cary, NC 27519 and is currently estimated at $555,859, approximately $330 per square foot. 203 Crystal Brook Ln is a home located in Wake County with nearby schools including Carpenter Elementary, Alston Ridge Middle School, and Green Hope High.
Ownership History
Date
Name
Owned For
Owner Type
Purchase Details
Closed on
Sep 19, 2016
Sold by
Beyda Marlee M and Beyda Elizabeth A
Bought by
Blackmun Robert and Blackmun Janet
Current Estimated Value
Home Financials for this Owner
Home Financials are based on the most recent Mortgage that was taken out on this home.
Original Mortgage
$225,000
Outstanding Balance
$178,674
Interest Rate
3.25%
Mortgage Type
Adjustable Rate Mortgage/ARM
Estimated Equity
$377,185
Purchase Details
Closed on
Apr 30, 2015
Sold by
James William Barry Patrick
Bought by
William Barry Patrick James Revocable Li
Purchase Details
Closed on
Nov 24, 2003
Sold by
Heritage Pines Llc
Bought by
James William B and James Marilyn
Home Financials for this Owner
Home Financials are based on the most recent Mortgage that was taken out on this home.
Original Mortgage
$193,300
Interest Rate
5.93%
Mortgage Type
Purchase Money Mortgage
Create a Home Valuation Report for This Property
The Home Valuation Report is an in-depth analysis detailing your home's value as well as a comparison with similar homes in the area
Home Values in the Area
Average Home Value in this Area
Purchase History
| Date | Buyer | Sale Price | Title Company |
|---|---|---|---|
| Blackmun Robert | $297,500 | None Available | |
| William Barry Patrick James Revocable Li | -- | None Available | |
| James William B | $215,000 | -- |
Source: Public Records
Mortgage History
| Date | Status | Borrower | Loan Amount |
|---|---|---|---|
| Open | Blackmun Robert | $225,000 | |
| Previous Owner | James William B | $193,300 |
Source: Public Records
Tax History Compared to Growth
Tax History
| Year | Tax Paid | Tax Assessment Tax Assessment Total Assessment is a certain percentage of the fair market value that is determined by local assessors to be the total taxable value of land and additions on the property. | Land | Improvement |
|---|---|---|---|---|
| 2025 | -- | $505,654 | $170,000 | $335,654 |
| 2024 | $4,260 | $505,654 | $170,000 | $335,654 |
| 2023 | $3,342 | $331,535 | $100,000 | $231,535 |
| 2022 | $3,218 | $331,535 | $100,000 | $231,535 |
| 2021 | $3,153 | $331,535 | $100,000 | $231,535 |
| 2020 | $3,170 | $331,535 | $100,000 | $231,535 |
| 2019 | $3,162 | $293,439 | $80,000 | $213,439 |
| 2018 | $2,967 | $293,439 | $80,000 | $213,439 |
| 2017 | $2,852 | $293,439 | $80,000 | $213,439 |
| 2016 | $2,809 | $293,439 | $80,000 | $213,439 |
| 2015 | $2,870 | $289,520 | $74,000 | $215,520 |
| 2014 | $2,707 | $289,520 | $74,000 | $215,520 |
Source: Public Records
Map
Nearby Homes
- 105 Rockport Ridge Way
- 101 Uplands Creek Dr
- 101 Crystal Brook Ln
- 204 Indian Elm Ln
- 408 Indian Elm Ln
- 1105 Dominion Hill Dr
- 309 Melvin Jackson Dr
- 2552 Hayes Hill Place
- 1320 Cozy Oak Ave
- 107 Badin Lake Ct
- 2725 Belmont View Loop
- 205 Benwell Ct
- 121 Goldenthal Ct
- 921 Lemster Ln
- 3533 Sienna Hill Place
- 484 Autumn Rain St
- 615 Carpenter Town Ln
- 104 Ashmore Dr
- 113 Beeley Ct
- 5724 Hurkett Ct
- 207 Crystal Brook Ln
- 2031 Heritage Pines Dr
- 203 Rockport Ridge Way
- 2029 Heritage Pines Dr
- 2027 Heritage Pines Dr
- 204 Crystal Brook Ln
- 202 Crystal Brook Ln
- 205 Rockport Ridge Way
- 206 Crystal Brook Ln
- 3001 Heritage Pines Dr
- 208 Crystal Brook Ln
- 2025 Heritage Pines Dr
- 3005 Heritage Pines Dr
- 207 Rockport Ridge Way
- 149 Rockport Ridge Way
- 200 Rockport Ridge Way
- 115 Crystal Brook Ln
- 103 Rockport Ridge Way
- 3007 Heritage Pines Dr
- 152 Rockport Ridge Way