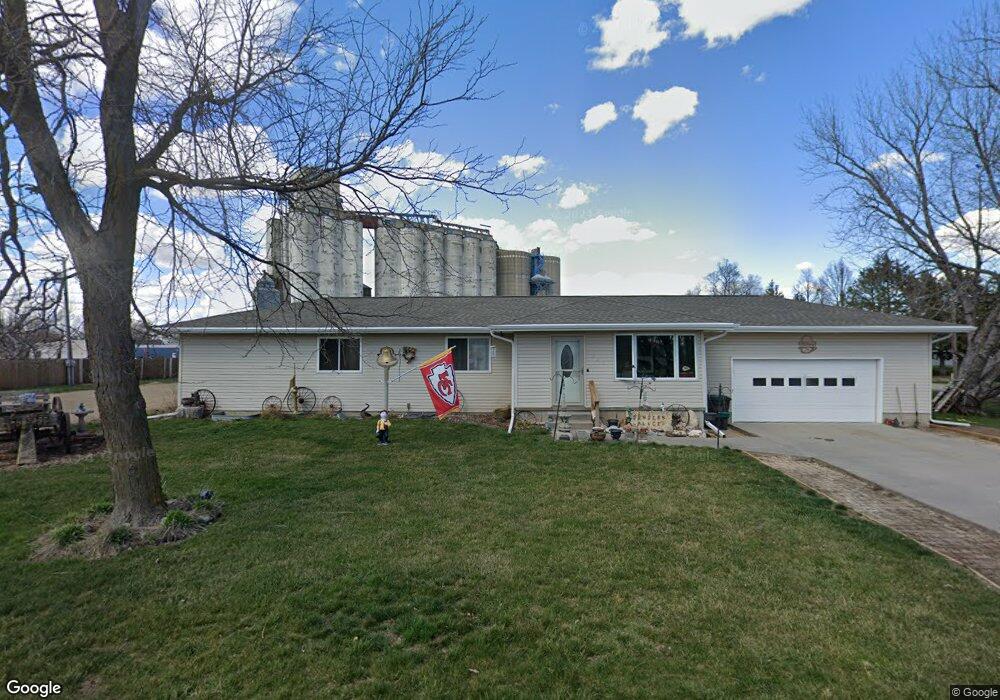
203 Dow St Giltner, NE 68841
Estimated Value: $296,434 - $325,000
4
Beds
3
Baths
1,457
Sq Ft
$214/Sq Ft
Est. Value
About This Home
This home is located at 203 Dow St, Giltner, NE 68841 and is currently estimated at $312,359, approximately $214 per square foot. 203 Dow St is a home with nearby schools including Giltner High School.
Ownership History
Date
Name
Owned For
Owner Type
Purchase Details
Closed on
Feb 14, 2018
Sold by
Cornerstone Bank
Bought by
Sanders Brian and Sanders Susan M
Current Estimated Value
Purchase Details
Closed on
Jul 21, 2010
Sold by
Village Of Giltner Nebraska
Bought by
Kielian Investment Properties Llc
Purchase Details
Closed on
Mar 3, 2010
Sold by
Village Of Phillips Nebraska
Bought by
Village Of Giltner Nebraska
Purchase Details
Closed on
Feb 26, 2009
Sold by
Dodson Ronald
Bought by
Village Of Phillips
Purchase Details
Closed on
Mar 1, 2006
Sold by
Dodson Nancy Ann
Bought by
Dodson Ronald J
Create a Home Valuation Report for This Property
The Home Valuation Report is an in-depth analysis detailing your home's value as well as a comparison with similar homes in the area
Purchase History
| Date | Buyer | Sale Price | Title Company |
|---|---|---|---|
| Sanders Brian | $1,000 | -- | |
| Kielian Investment Properties Llc | $2,650 | -- | |
| Village Of Giltner Nebraska | -- | -- | |
| Village Of Phillips | -- | -- | |
| Dodson Ronald J | -- | -- |
Source: Public Records
Tax History
| Year | Tax Paid | Tax Assessment Tax Assessment Total Assessment is a certain percentage of the fair market value that is determined by local assessors to be the total taxable value of land and additions on the property. | Land | Improvement |
|---|---|---|---|---|
| 2025 | $1,957 | $197,995 | $15,400 | $182,595 |
| 2024 | $1,957 | $197,995 | $15,400 | $182,595 |
| 2023 | $2,953 | $197,995 | $15,400 | $182,595 |
| 2022 | $2,496 | $158,375 | $12,600 | $145,775 |
| 2021 | $2,536 | $158,375 | $12,600 | $145,775 |
| 2020 | $2,481 | $158,375 | $12,600 | $145,775 |
| 2019 | $2,507 | $158,375 | $12,600 | $145,775 |
| 2018 | $2,188 | $158,375 | $12,600 | $145,775 |
| 2017 | $2,271 | $158,375 | $12,600 | $145,775 |
| 2016 | $1,632 | $153,775 | $7,400 | $146,375 |
| 2010 | $132 | $7,400 | $0 | $0 |
Source: Public Records
Map
Nearby Homes
- 211 N Derby Ave
- 209 Tonya Dr
- 631 N Derby Ave
- 735 N Derby Ave
- 10th Road S J Rd
- J Road 10th Road (South)
- W 9th Road S M Rd
- 1210 W 7 Rd
- S M Road W 9th Rd (Farmland)
- 7th Road & O Rd
- 7th Road P Rd
- 605 7th St
- 510 7th St
- 1107 1st Ave
- 1491 Highlander Ln
- 412 H St
- 1002 A St
- 1407 Cottage Park Dr
- 9 Countryside Ct
- 807 6th St