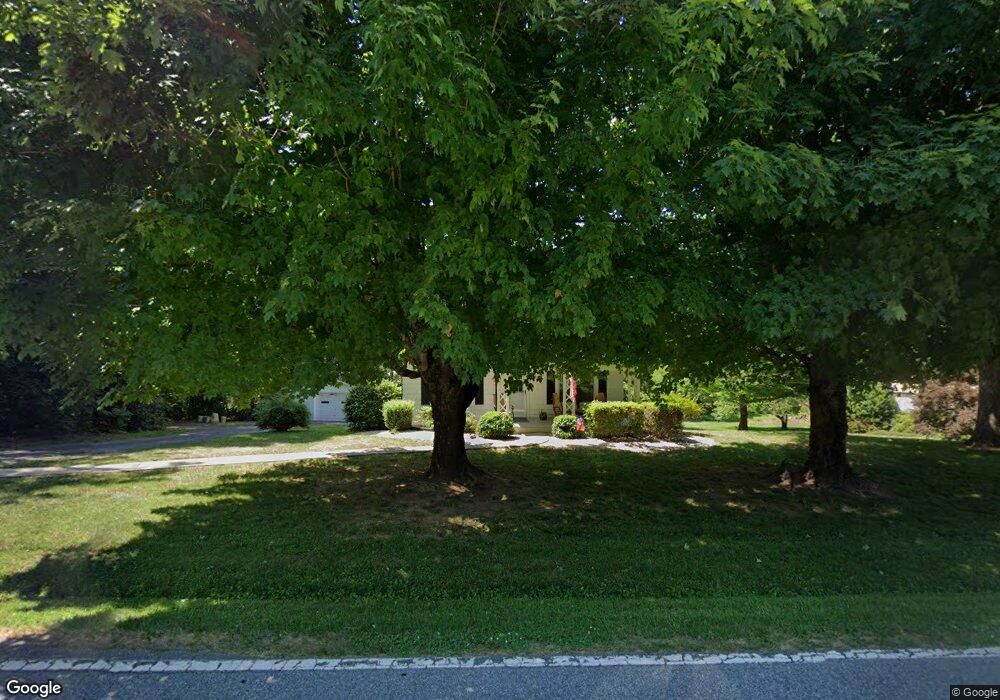
203 Drexel Rd Morganton, NC 28655
Estimated Value: $170,551 - $180,000
2
Beds
1
Bath
888
Sq Ft
$198/Sq Ft
Est. Value
About This Home
This home is located at 203 Drexel Rd, Morganton, NC 28655 and is currently estimated at $175,888, approximately $198 per square foot. 203 Drexel Rd is a home located in Burke County with nearby schools including Mull Elementary School, Liberty Middle School, and Robert L. Patton High School.
Ownership History
Date
Name
Owned For
Owner Type
Purchase Details
Closed on
Jul 5, 2022
Sold by
Ann Bush Patricia
Bought by
Bush Paul T and Bush Kimberly A
Current Estimated Value
Home Financials for this Owner
Home Financials are based on the most recent Mortgage that was taken out on this home.
Original Mortgage
$86,200
Outstanding Balance
$81,897
Interest Rate
5.1%
Mortgage Type
New Conventional
Estimated Equity
$93,991
Purchase Details
Closed on
Jun 30, 2022
Sold by
Thurman Bush and Thurman Randy
Bought by
Bush Patricia
Home Financials for this Owner
Home Financials are based on the most recent Mortgage that was taken out on this home.
Original Mortgage
$86,200
Outstanding Balance
$81,897
Interest Rate
5.1%
Mortgage Type
New Conventional
Estimated Equity
$93,991
Create a Home Valuation Report for This Property
The Home Valuation Report is an in-depth analysis detailing your home's value as well as a comparison with similar homes in the area
Home Values in the Area
Average Home Value in this Area
Purchase History
| Date | Buyer | Sale Price | Title Company |
|---|---|---|---|
| Bush Paul T | $115,000 | Ayers James R | |
| Bush Paul T | $115,000 | None Listed On Document | |
| Bush Patricia | $13,000 | Ayers James R |
Source: Public Records
Mortgage History
| Date | Status | Borrower | Loan Amount |
|---|---|---|---|
| Open | Bush Paul T | $86,200 | |
| Closed | Bush Paul T | $86,200 | |
| Closed | Bush Patricia | $86,200 |
Source: Public Records
Tax History Compared to Growth
Tax History
| Year | Tax Paid | Tax Assessment Tax Assessment Total Assessment is a certain percentage of the fair market value that is determined by local assessors to be the total taxable value of land and additions on the property. | Land | Improvement |
|---|---|---|---|---|
| 2025 | $924 | $126,983 | $13,381 | $113,602 |
| 2024 | $890 | $126,983 | $13,381 | $113,602 |
| 2023 | $790 | $111,224 | $13,381 | $97,843 |
| 2022 | $610 | $66,421 | $11,431 | $54,990 |
| 2021 | $584 | $66,421 | $11,431 | $54,990 |
| 2020 | $580 | $66,421 | $11,431 | $54,990 |
| 2019 | $580 | $66,421 | $11,431 | $54,990 |
| 2018 | $585 | $67,046 | $11,431 | $55,615 |
| 2017 | $583 | $67,046 | $11,431 | $55,615 |
| 2016 | $564 | $67,046 | $11,431 | $55,615 |
| 2015 | $561 | $67,046 | $11,431 | $55,615 |
| 2014 | $560 | $67,046 | $11,431 | $55,615 |
| 2013 | $560 | $67,046 | $11,431 | $55,615 |
Source: Public Records
Map
Nearby Homes
- 1438 Bethel Rd
- VL Blvd
- 805 Old Nc 18 Hwy
- 3023 Woodstream Dr
- 2646 Mount Home Church Rd
- 204 Old Mill Dr
- 632 Drexel Rd
- 2912 Woodstream Dr
- 3515 High Peak Valley
- 107 Dale Cir
- 108 Logan St Unit 110
- 106 Rebel Run
- 350 Summers Rd
- 107 N Matthews St
- 107 Oakwood St
- 3151 Morganton Furniture Rd
- 1376 Old Nc 18 Unit 1380
- 2491 Watts St
- 602 Enola Rd
- 3901 & 3913 High Peak Terrace Rd
- 109 Drexel Rd
- 213,215 Believer's Way
- 215 Believer's Way
- 206 Drexel Rd
- 213 Believers Way Unit 213A
- 103 Drexel Rd
- 103 Drexel Rd
- 214 Steakhouse Rd
- 2705 Nc 18 S
- 209 Drexel Rd
- 210 Drexel Rd
- 116 Drexel Rd
- 215 Steakhouse Rd
- 217 Steakhouse Rd
- 212 Drexel Rd
- 213 Steakhouse Rd
- 213 Drexel Rd
- 1.24 Acres Drexel Rd
- 204 Steakhouse Rd
- 209 Steakhouse Rd