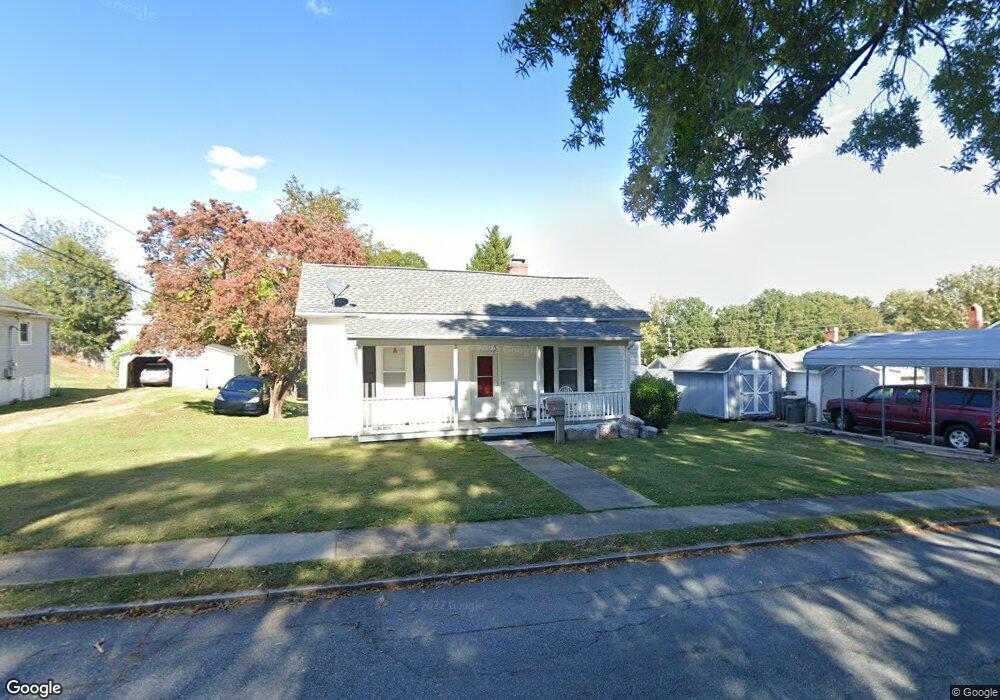
203 E 4th St Kannapolis, NC 28083
Estimated Value: $189,000 - $247,000
2
Beds
2
Baths
1,332
Sq Ft
$171/Sq Ft
Est. Value
About This Home
This home is located at 203 E 4th St, Kannapolis, NC 28083 and is currently estimated at $227,305, approximately $170 per square foot. 203 E 4th St is a home located in Cabarrus County with nearby schools including North Kannapolis Elementary School, Kannapolis Middle, and A.L. Brown High School.
Ownership History
Date
Name
Owned For
Owner Type
Purchase Details
Closed on
Feb 28, 2020
Sold by
Lanaghan Jack and Lanaghan Maria Dora
Bought by
Medina Maria Cristina
Current Estimated Value
Home Financials for this Owner
Home Financials are based on the most recent Mortgage that was taken out on this home.
Original Mortgage
$61,750
Outstanding Balance
$54,792
Interest Rate
3.6%
Mortgage Type
New Conventional
Estimated Equity
$172,513
Purchase Details
Closed on
Aug 29, 2002
Sold by
Broadway Arnold Edward
Bought by
Lanaghan Jack
Home Financials for this Owner
Home Financials are based on the most recent Mortgage that was taken out on this home.
Original Mortgage
$45,000
Interest Rate
5.96%
Purchase Details
Closed on
Apr 1, 1997
Bought by
Broadway Arnold Edward
Create a Home Valuation Report for This Property
The Home Valuation Report is an in-depth analysis detailing your home's value as well as a comparison with similar homes in the area
Home Values in the Area
Average Home Value in this Area
Purchase History
| Date | Buyer | Sale Price | Title Company |
|---|---|---|---|
| Medina Maria Cristina | $65,000 | None Available | |
| Lanaghan Jack | $45,000 | -- | |
| Broadway Arnold Edward | $35,000 | -- |
Source: Public Records
Mortgage History
| Date | Status | Borrower | Loan Amount |
|---|---|---|---|
| Open | Medina Maria Cristina | $61,750 | |
| Previous Owner | Lanaghan Jack | $45,000 |
Source: Public Records
Tax History
| Year | Tax Paid | Tax Assessment Tax Assessment Total Assessment is a certain percentage of the fair market value that is determined by local assessors to be the total taxable value of land and additions on the property. | Land | Improvement |
|---|---|---|---|---|
| 2025 | $2,158 | $190,080 | $44,000 | $146,080 |
| 2024 | $2,158 | $190,080 | $44,000 | $146,080 |
| 2023 | $1,199 | $87,530 | $32,000 | $55,530 |
| 2022 | $1,199 | $87,530 | $32,000 | $55,530 |
| 2021 | $1,199 | $87,530 | $32,000 | $55,530 |
| 2020 | $1,199 | $87,530 | $32,000 | $55,530 |
| 2019 | $816 | $59,590 | $13,600 | $45,990 |
| 2018 | $804 | $59,590 | $13,600 | $45,990 |
| 2017 | $793 | $59,590 | $13,600 | $45,990 |
| 2016 | $793 | $60,850 | $18,400 | $42,450 |
| 2015 | $767 | $60,850 | $18,400 | $42,450 |
| 2014 | $767 | $60,850 | $18,400 | $42,450 |
Source: Public Records
Map
Nearby Homes
- 419 N East Ave
- 510 N East Ave
- 399 Janie St
- 606 N Juniper Ave
- 200 Martin Luther King Junior Ave
- 514 Jackson Park Rd
- 535 Martin Luther King Junior Ave
- 541 Martin Luther King Junior Ave
- 911 N Walnut St
- 601 W 7th St
- 311 Silverleaf Cir
- 606 Jackson St
- 303 E 10th St
- 602 W 8th St
- 600 W 8th St
- 604 W 8th St
- 1101 N Juniper Ave
- 208 Locust St
- 900 Alma Ave
- 704 Sloop Ave
Your Personal Tour Guide
Ask me questions while you tour the home.