Estimated Value: $231,367 - $287,000
Studio
2
Baths
1,924
Sq Ft
$135/Sq Ft
Est. Value
About This Home
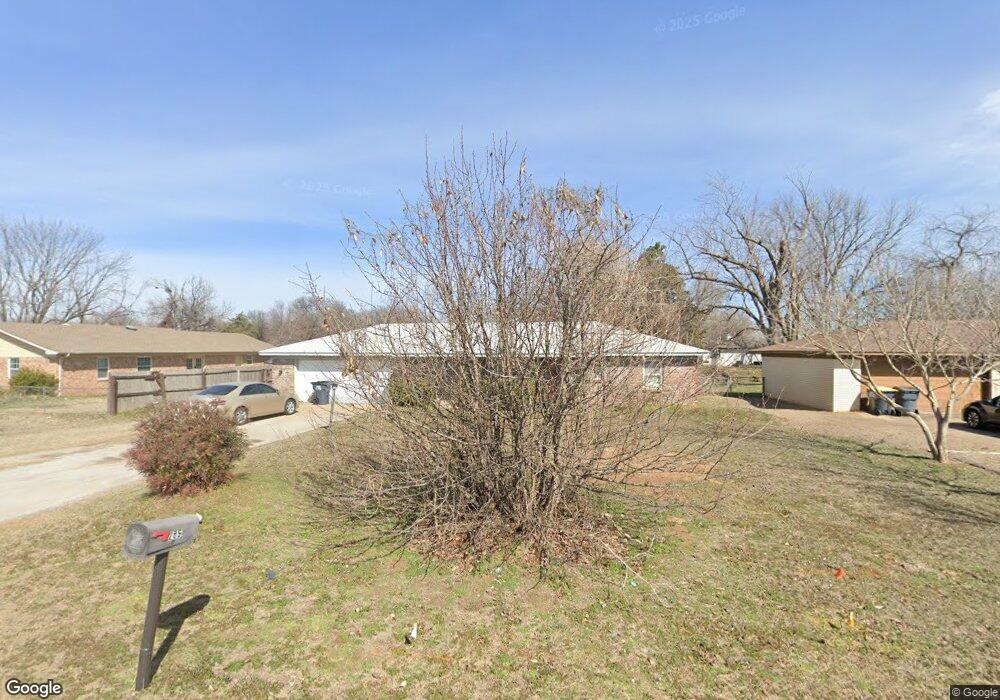
This home is located at 203 E F St, Jenks, OK 74037 and is currently estimated at $260,342, approximately $135 per square foot. 203 E F St is a home located in Tulsa County with nearby schools including Jenks West Elementary School, Jenks Middle School, and Jenks West Intermediate Elementary School.
Ownership History
Date
Name
Owned For
Owner Type
Purchase Details
Closed on
Sep 26, 2022
Sold by
Beaver Mariam Ruth
Bought by
Beaver Mariam Ruth and Beaver Brant Robb
Current Estimated Value
Purchase Details
Closed on
Dec 5, 2018
Sold by
Beaver Brant Robb and Beaver Brent Bert
Bought by
Beaver Herilla Robin Leann
Home Financials for this Owner
Home Financials are based on the most recent Mortgage that was taken out on this home.
Original Mortgage
$50,000
Interest Rate
4.9%
Mortgage Type
New Conventional
Purchase Details
Closed on
Nov 1, 2002
Sold by
Beaver Robert Perry and Beaver Mariam Ruth
Bought by
Beaver Brant R and Beaver Brent B
Home Financials for this Owner
Home Financials are based on the most recent Mortgage that was taken out on this home.
Original Mortgage
$81,352
Interest Rate
6.01%
Mortgage Type
FHA
Create a Home Valuation Report for This Property
The Home Valuation Report is an in-depth analysis detailing your home's value as well as a comparison with similar homes in the area
Home Values in the Area
Average Home Value in this Area
Purchase History
We collect this data history from publicly available records. To have your information removed, we recommend requesting removal directly through your county’s website.
| Date | Buyer | Sale Price | Title Company |
|---|---|---|---|
| Beaver Mariam Ruth | -- | None Listed On Document | |
| Beaver Herilla Robin Leann | -- | Integrity Title & Closing | |
| Beaver Brant R | $82,000 | Brookside Title & Escrow Ltd |
Source: Public Records
Mortgage History
We collect this data history from publicly available records. To have your information removed, we recommend requesting removal directly through your county’s website.
| Date | Status | Borrower | Loan Amount |
|---|---|---|---|
| Previous Owner | Beaver Herilla Robin Leann | $50,000 | |
| Previous Owner | Beaver Brant R | $81,352 |
Source: Public Records
Tax History
| Year | Tax Paid | Tax Assessment Tax Assessment Total Assessment is a certain percentage of the fair market value that is determined by local assessors to be the total taxable value of land and additions on the property. | Land | Improvement |
|---|---|---|---|---|
| 2025 | $2,299 | $18,326 | $2,069 | $16,257 |
| 2024 | $2,116 | $17,453 | $2,138 | $15,315 |
| 2023 | $2,116 | $16,621 | $2,023 | $14,598 |
| 2022 | $2,035 | $15,830 | $2,891 | $12,939 |
| 2021 | $1,963 | $15,077 | $2,754 | $12,323 |
| 2020 | $1,828 | $14,358 | $2,622 | $11,736 |
| 2019 | $1,753 | $13,675 | $2,498 | $11,177 |
| 2018 | $1,681 | $13,023 | $2,377 | $10,646 |
| 2017 | $1,606 | $12,647 | $2,308 | $10,339 |
| 2016 | $1,567 | $12,045 | $2,277 | $9,768 |
| 2015 | $1,597 | $12,045 | $2,277 | $9,768 |
| 2014 | $1,633 | $12,045 | $2,277 | $9,768 |
Source: Public Records
Map
Nearby Homes
- 216 E J St
- 408 E E St
- 1317 N 1st St
- 406 E B St
- 0 E A St
- 411 N Forest St
- 407 N Forest St
- 422 N Forest St
- 1012 N Forest Place
- 711 E Karma Ave
- 1007 W D St
- 0 Aquarium Dr
- 649 W 101st Place S
- 2423 E 87th St Unit 3D174
- 2421 E 87th St Unit 2U261
- 2421 E 87th St Unit 2D161
- 2826 E 90th St Unit 1602
- 2805 E 90th St Unit 3-1
- 2855 E 90th St Unit 28
- 2850 E 90th St Unit 1208
Your Personal Tour Guide
Ask me questions while you tour the home.