Estimated Value: $68,559 - $145,000
Studio
--
Bath
800
Sq Ft
$128/Sq Ft
Est. Value
About This Home
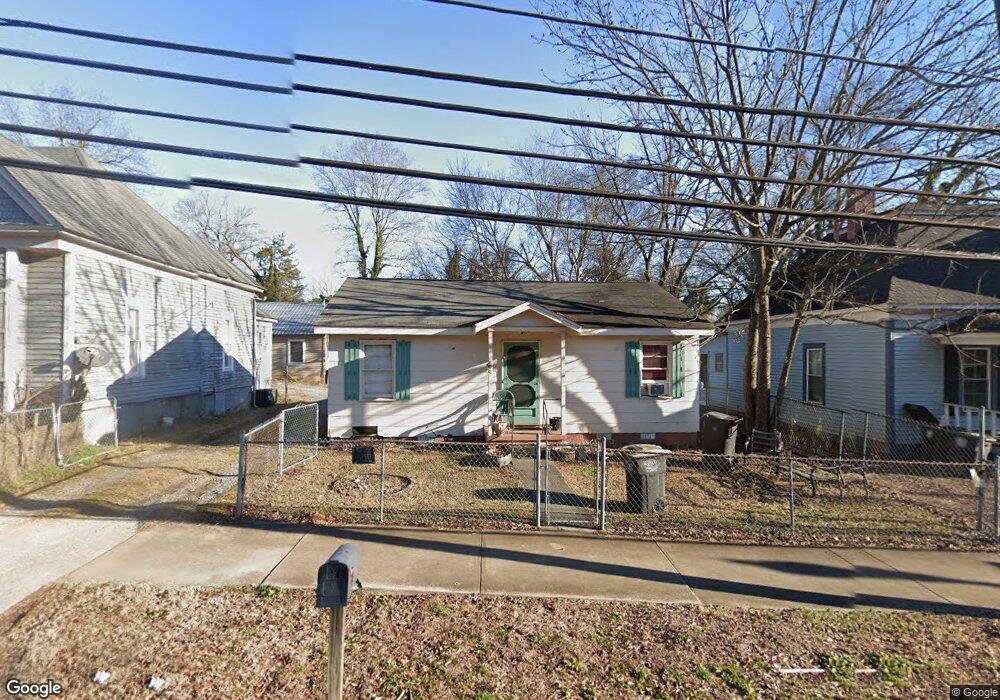
This home is located at 203 E Main St SW, Rome, GA 30161 and is currently estimated at $102,640, approximately $128 per square foot. 203 E Main St SW is a home located in Floyd County with nearby schools including Rome High School, Darlington School, and St. Mary School.
Ownership History
Date
Name
Owned For
Owner Type
Purchase Details
Closed on
Dec 28, 1984
Sold by
Davidson Sherry Auhoffer
Bought by
Ford Charles S
Current Estimated Value
Purchase Details
Closed on
Jan 20, 1983
Sold by
Barrett Toles C and Barrett Douglas H
Bought by
Davidson Sherry Auhoffer
Purchase Details
Closed on
Oct 30, 1980
Sold by
Toles C Max
Bought by
Barrett Toles C and Barrett Douglas H
Purchase Details
Closed on
Oct 29, 1980
Sold by
Pine Log Land Co & G Patrick Flint & Har
Bought by
Toles C Max
Purchase Details
Closed on
Jul 2, 1974
Sold by
Pine Log Land Co & G Patrick Flint
Bought by
Pine Log Land Co & G Patrick Flint & Har
Purchase Details
Closed on
Feb 19, 1973
Bought by
P and R
Purchase Details
Closed on
Nov 9, 1971
Sold by
King Arlin M
Bought by
Cooper John S
Purchase Details
Closed on
Dec 30, 1964
Sold by
King Arlin Margaret
Bought by
King Arlin M
Purchase Details
Closed on
Dec 15, 1964
Sold by
Morris Rl Mrs
Bought by
King Arlin Margaret
Purchase Details
Closed on
Jan 1, 1901
Bought by
Morris Rl Mrs
Create a Home Valuation Report for This Property
The Home Valuation Report is an in-depth analysis detailing your home's value as well as a comparison with similar homes in the area
Home Values in the Area
Average Home Value in this Area
Purchase History
| Date | Buyer | Sale Price | Title Company |
|---|---|---|---|
| Ford Charles S | $93,000 | -- | |
| Davidson Sherry Auhoffer | $74,000 | -- | |
| Barrett Toles C | $15,000 | -- | |
| Toles C Max | $30,000 | -- | |
| Pine Log Land Co & G Patrick Flint & Har | -- | -- | |
| P | -- | -- | |
| Pine Log Land Co & G Patrick Flint | -- | -- | |
| Cooper John S | $25,000 | -- | |
| King Arlin M | -- | -- | |
| King Arlin Margaret | -- | -- | |
| Morris Rl Mrs | -- | -- |
Source: Public Records
Tax History
| Year | Tax Paid | Tax Assessment Tax Assessment Total Assessment is a certain percentage of the fair market value that is determined by local assessors to be the total taxable value of land and additions on the property. | Land | Improvement |
|---|---|---|---|---|
| 2025 | $657 | $18,366 | $4,404 | $13,962 |
| 2024 | $657 | $16,874 | $4,004 | $12,870 |
| 2023 | $394 | $11,234 | $3,640 | $7,594 |
| 2022 | $334 | $9,162 | $2,912 | $6,250 |
| 2021 | $315 | $8,490 | $2,912 | $5,578 |
| 2020 | $282 | $7,526 | $2,275 | $5,251 |
| 2019 | $249 | $6,740 | $2,275 | $4,465 |
| 2018 | $237 | $6,391 | $2,275 | $4,116 |
| 2017 | $230 | $6,208 | $2,275 | $3,933 |
| 2016 | $224 | $6,040 | $2,240 | $3,800 |
| 2015 | $224 | $6,040 | $2,240 | $3,800 |
| 2014 | $224 | $6,400 | $2,240 | $4,160 |
Source: Public Records
Map
Nearby Homes
- 210 E Main St SW
- 200 Cave Spring St SW
- 113 E Main St SW
- 13 N Blanche Ave SW
- 111 Lookout Cir SW
- 618 S Broad St SW
- 113 Lookout Cir SW
- 115 Lookout Cir SW
- 3 Lookout Ave SW
- 529 Branham Ave SW
- 515 Harper Ave SW
- 2 Harbin Aly SW
- 901 S Broad St SW
- 903 S Broad St SW
- 3 Porter St SW
- 1011 Walnut Ave SW
- 6 Pollock St SW
- 18 Butler St SW
- 3 Grover St SW
- 1 E 11th St SW
- 201 E Main St SW
- 205 E Main St SW
- 4 N Blanche Ave SW
- 207 E Main St SW
- 202 E Main St SW
- 121 E Main St SW
- 191 E Main St SW Unit 2
- 204 E Main St SW
- 206 E Main St SW
- 6 N Blanche Ave SW
- 119 E Main St SW
- 208 E Main St SW
- 208 E Main St SW
- 118 E Main St SW
- 8 N Blanche Ave SW
- 117 E Main St SW
- 116 E Main St SW
- 5 N Blanche Ave SW
- 10 N Blanche Ave SW
- 115 E Main St SW
Your Personal Tour Guide
Ask me questions while you tour the home.