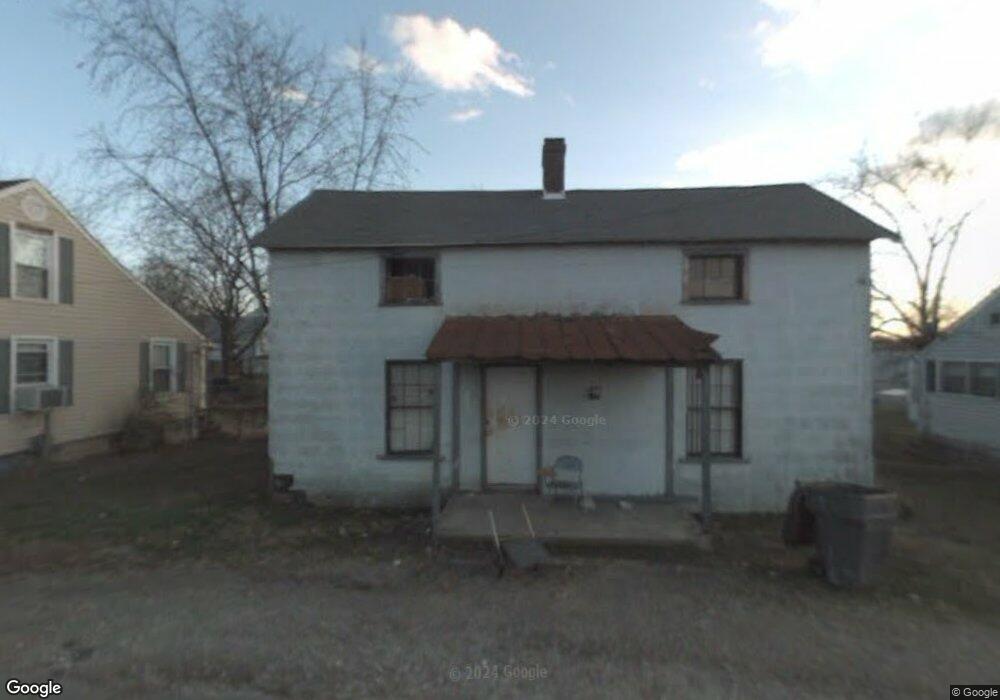
203 Edna St Reidsville, NC 27320
Estimated Value: $115,000 - $134,426
4
Beds
1
Bath
1,400
Sq Ft
$91/Sq Ft
Est. Value
About This Home
This home is located at 203 Edna St, Reidsville, NC 27320 and is currently estimated at $127,857, approximately $91 per square foot. 203 Edna St is a home located in Rockingham County with nearby schools including Reidsville High School, Moss Street Elementary, and Reidsville Middle School.
Ownership History
Date
Name
Owned For
Owner Type
Purchase Details
Closed on
Jun 30, 2008
Sold by
North Carolina Realty
Bought by
Mccollum Shamica S
Current Estimated Value
Home Financials for this Owner
Home Financials are based on the most recent Mortgage that was taken out on this home.
Original Mortgage
$49,227
Outstanding Balance
$31,580
Interest Rate
5.96%
Mortgage Type
FHA
Estimated Equity
$96,277
Purchase Details
Closed on
Dec 31, 2007
Sold by
Manus Connie T and Manus Steve Dennis
Bought by
North Carolina Realty
Create a Home Valuation Report for This Property
The Home Valuation Report is an in-depth analysis detailing your home's value as well as a comparison with similar homes in the area
Home Values in the Area
Average Home Value in this Area
Purchase History
| Date | Buyer | Sale Price | Title Company |
|---|---|---|---|
| Mccollum Shamica S | $50,000 | None Available | |
| North Carolina Realty | $6,355 | None Available |
Source: Public Records
Mortgage History
| Date | Status | Borrower | Loan Amount |
|---|---|---|---|
| Open | Mccollum Shamica S | $49,227 |
Source: Public Records
Tax History Compared to Growth
Tax History
| Year | Tax Paid | Tax Assessment Tax Assessment Total Assessment is a certain percentage of the fair market value that is determined by local assessors to be the total taxable value of land and additions on the property. | Land | Improvement |
|---|---|---|---|---|
| 2025 | $1,046 | $84,351 | $4,929 | $79,422 |
| 2024 | $1,046 | $84,351 | $4,929 | $79,422 |
| 2023 | $1,046 | $45,117 | $3,975 | $41,142 |
| 2022 | $647 | $45,117 | $3,975 | $41,142 |
| 2021 | $647 | $45,117 | $3,975 | $41,142 |
| 2020 | $647 | $45,117 | $3,975 | $41,142 |
| 2019 | $647 | $45,117 | $3,975 | $41,142 |
| 2018 | $681 | $47,403 | $6,210 | $41,193 |
| 2017 | $681 | $47,403 | $6,210 | $41,193 |
| 2015 | $688 | $47,403 | $6,210 | $41,193 |
| 2014 | -- | $47,403 | $6,210 | $41,193 |
Source: Public Records
Map
Nearby Homes