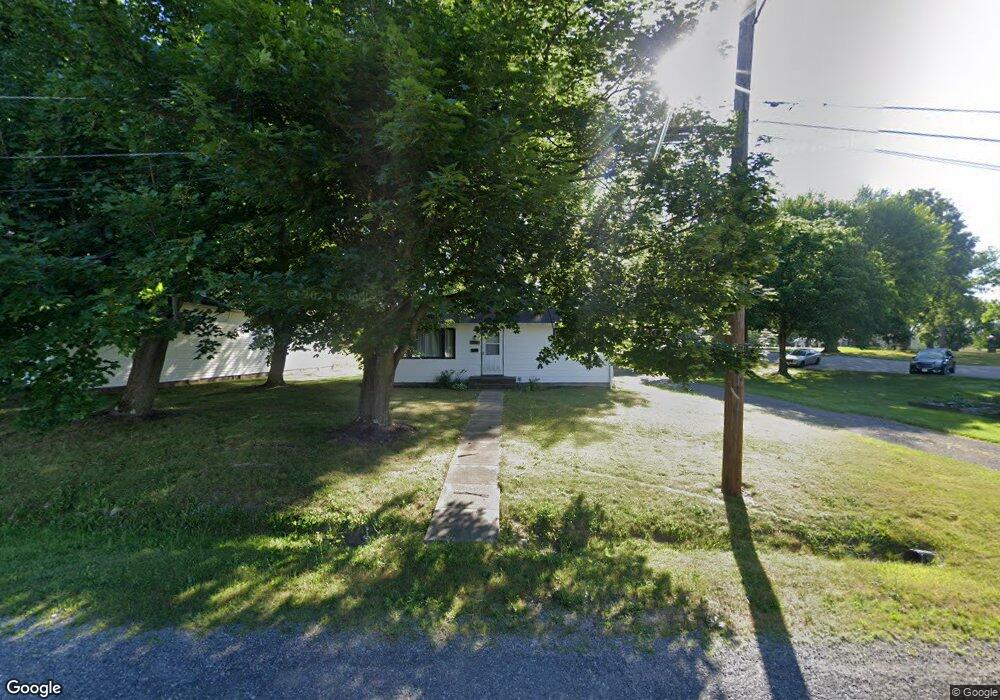
203 Elm St Leetonia, OH 44431
Estimated Value: $88,939 - $127,000
2
Beds
1
Bath
936
Sq Ft
$120/Sq Ft
Est. Value
About This Home
This home is located at 203 Elm St, Leetonia, OH 44431 and is currently estimated at $112,485, approximately $120 per square foot. 203 Elm St is a home located in Columbiana County with nearby schools including Leetonia Elementary K-6, Leetonia Elementary School, and Leetonia Jr./Sr. High School.
Ownership History
Date
Name
Owned For
Owner Type
Purchase Details
Closed on
Nov 26, 2018
Sold by
Goor Brenda K
Bought by
Iboden Seth W
Current Estimated Value
Home Financials for this Owner
Home Financials are based on the most recent Mortgage that was taken out on this home.
Original Mortgage
$49,094
Outstanding Balance
$43,526
Interest Rate
5.12%
Mortgage Type
FHA
Estimated Equity
$68,959
Purchase Details
Closed on
Oct 24, 2018
Sold by
Fopr Robert A
Bought by
Foor Brenda K
Home Financials for this Owner
Home Financials are based on the most recent Mortgage that was taken out on this home.
Original Mortgage
$49,094
Outstanding Balance
$43,526
Interest Rate
5.12%
Mortgage Type
FHA
Estimated Equity
$68,959
Purchase Details
Closed on
Aug 5, 2004
Sold by
Stevens Coral C and Rettig Jon W
Bought by
Foor Robert A and Foor Brenda K
Home Financials for this Owner
Home Financials are based on the most recent Mortgage that was taken out on this home.
Original Mortgage
$62,505
Interest Rate
6.34%
Mortgage Type
FHA
Create a Home Valuation Report for This Property
The Home Valuation Report is an in-depth analysis detailing your home's value as well as a comparison with similar homes in the area
Home Values in the Area
Average Home Value in this Area
Purchase History
| Date | Buyer | Sale Price | Title Company |
|---|---|---|---|
| Iboden Seth W | -- | -- | |
| Foor Brenda K | -- | -- | |
| Foor Robert A | $63,000 | -- | |
| Foor Robert A | -- | Midland Title |
Source: Public Records
Mortgage History
| Date | Status | Borrower | Loan Amount |
|---|---|---|---|
| Open | Iboden Seth W | $49,094 | |
| Previous Owner | Foor Robert A | $62,505 |
Source: Public Records
Tax History Compared to Growth
Tax History
| Year | Tax Paid | Tax Assessment Tax Assessment Total Assessment is a certain percentage of the fair market value that is determined by local assessors to be the total taxable value of land and additions on the property. | Land | Improvement |
|---|---|---|---|---|
| 2024 | $794 | $22,300 | $2,660 | $19,640 |
| 2023 | $795 | $22,300 | $2,660 | $19,640 |
| 2022 | $798 | $22,300 | $2,660 | $19,640 |
| 2021 | $833 | $22,190 | $3,430 | $18,760 |
| 2020 | $853 | $22,190 | $3,430 | $18,760 |
| 2019 | $861 | $22,190 | $3,430 | $18,760 |
| 2018 | $846 | $20,170 | $3,120 | $17,050 |
| 2017 | $856 | $20,170 | $3,120 | $17,050 |
| 2016 | $792 | $19,110 | $3,220 | $15,890 |
| 2015 | $792 | $19,110 | $3,220 | $15,890 |
| 2014 | $782 | $19,110 | $3,220 | $15,890 |
Source: Public Records
Map
Nearby Homes
- 406 Orchard Hill Dr
- 405 Orchard Dr
- 38875 Old State Route 344
- 375 Pearl St
- 457 Cherry Fork Ave
- 489 Columbia St
- 275 Walnut St
- 200 E Main St
- 38495 Old State Route 344
- 909 Lisbon Rd
- 955 W Main St
- 40330 Kelly Park Rd
- 39144 State Route 558
- 3600 Leetonia Rd
- 3753 Grafton Rd
- 36700 Butcher Rd
- 1229 Columbiana-Lisbon Rd Unit 41
- 780 Cunningham Rd
- 859 Cunningham Rd
- 366 Lisbon St