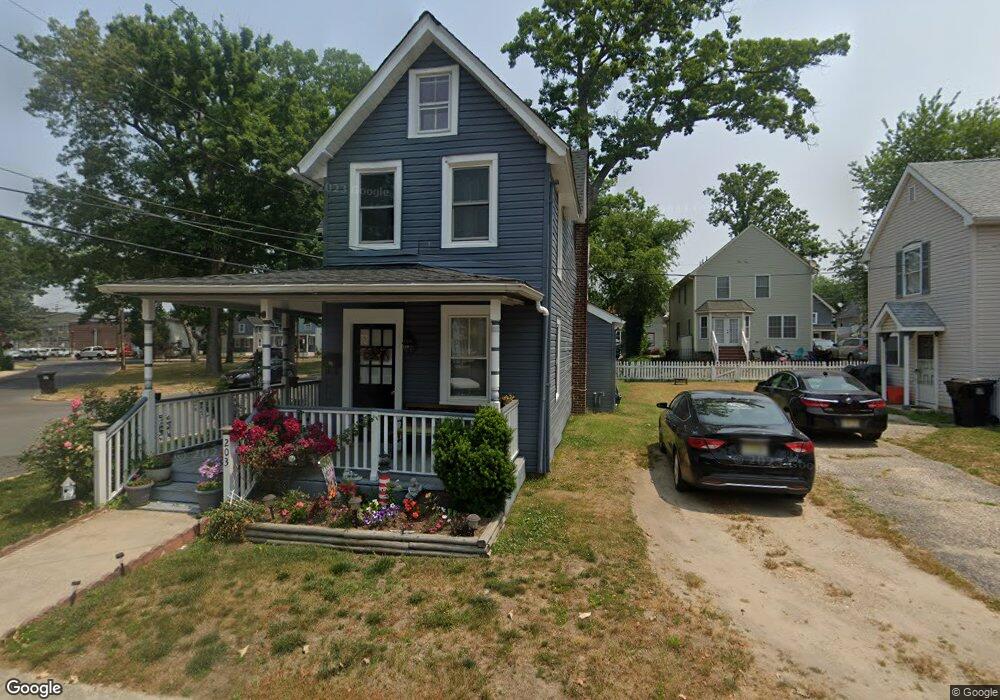
203 Embury Ave Pitman, NJ 08071
Estimated Value: $215,000 - $302,000
Studio
--
Bath
1,128
Sq Ft
$235/Sq Ft
Est. Value
About This Home
This home is located at 203 Embury Ave, Pitman, NJ 08071 and is currently estimated at $264,748, approximately $234 per square foot. 203 Embury Ave is a home located in Gloucester County with nearby schools including W.C.K. Walls Elementary School, Pitman Middle School, and Pitman High School.
Ownership History
Date
Name
Owned For
Owner Type
Purchase Details
Closed on
Apr 25, 2009
Sold by
Duarte Hugo Eduardo
Bought by
Duarte Hugo Eduardo and Cervantes Zoraida
Current Estimated Value
Purchase Details
Closed on
Nov 8, 2007
Sold by
Duarte Hugo and Caceres Antonio Luis
Bought by
Duarte Hugo Eduardo
Purchase Details
Closed on
Oct 17, 2003
Sold by
Duarte Maria Elena
Bought by
Duarte Hugo Eduardo
Create a Home Valuation Report for This Property
The Home Valuation Report is an in-depth analysis detailing your home's value as well as a comparison with similar homes in the area
Home Values in the Area
Average Home Value in this Area
Purchase History
| Date | Buyer | Sale Price | Title Company |
|---|---|---|---|
| Duarte Hugo Eduardo | -- | None Available | |
| Duarte Hugo Eduardo | -- | None Available | |
| Duarte Hugo Eduardo | -- | -- |
Source: Public Records
Tax History
| Year | Tax Paid | Tax Assessment Tax Assessment Total Assessment is a certain percentage of the fair market value that is determined by local assessors to be the total taxable value of land and additions on the property. | Land | Improvement |
|---|---|---|---|---|
| 2025 | $6,116 | $175,100 | $28,100 | $147,000 |
| 2024 | $5,955 | $175,100 | $28,100 | $147,000 |
Source: Public Records
Map
Nearby Homes
- 135 Laurel Ave
- 198 West Ave
- 349 W Jersey Ave
- 119 121 Grandview Ave
- 14 4th Ave
- 127 W Holly Ave
- 407 Tuohy Ave
- 315 Lake Ave
- 302 Montgomery Ave
- 344 Columbia Ave
- 302 Washington Ave
- 205 Adams Ave
- 1040 N Main St
- 103 N Brentwood Ave
- 237 Adams Ave
- 508 Hudson Ave
- 603 Hudson Ave
- 30 N Woodbury Rd
- 0 Lambs Rd Unit NJGL2048944
- 740 Carpenter St
Your Personal Tour Guide
Ask me questions while you tour the home.