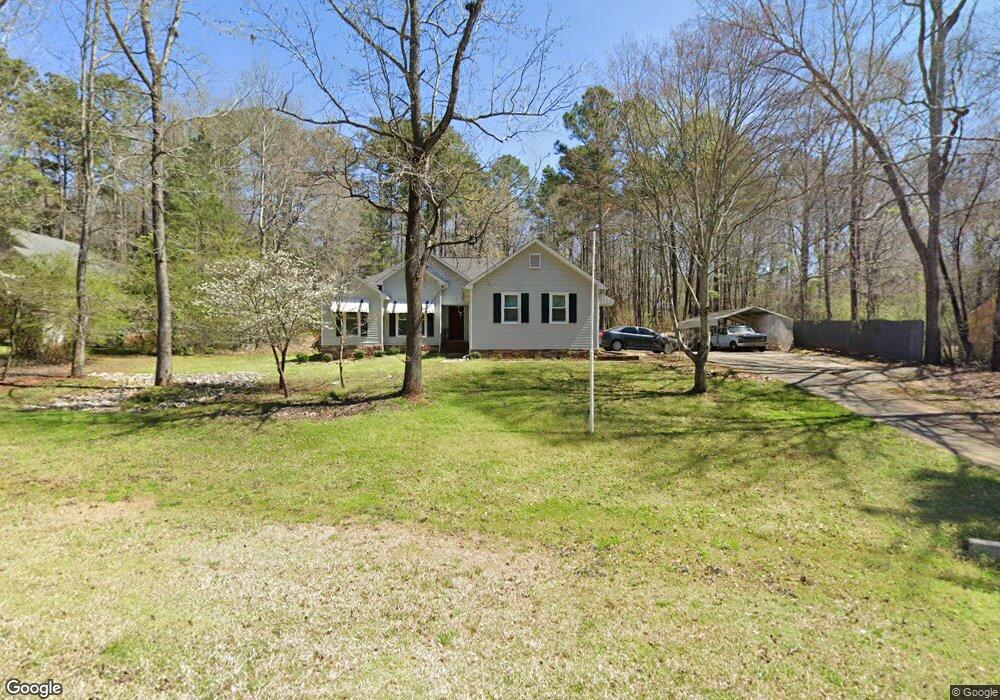
203 Englewood Dr Lagrange, GA 30240
Estimated Value: $239,000 - $266,000
3
Beds
2
Baths
1,951
Sq Ft
$129/Sq Ft
Est. Value
About This Home
This home is located at 203 Englewood Dr, Lagrange, GA 30240 and is currently estimated at $251,188, approximately $128 per square foot. 203 Englewood Dr is a home located in Troup County with nearby schools including Franklin Forest Elementary School, Hillcrest Elementary School, and Hollis Hand Elementary School.
Ownership History
Date
Name
Owned For
Owner Type
Purchase Details
Closed on
Apr 9, 2018
Sold by
Mccord Harvey James
Bought by
Mccord Harvey James and Rosa V Mccord V
Current Estimated Value
Home Financials for this Owner
Home Financials are based on the most recent Mortgage that was taken out on this home.
Original Mortgage
$127,645
Outstanding Balance
$110,551
Interest Rate
4.75%
Mortgage Type
FHA
Estimated Equity
$140,637
Purchase Details
Closed on
Feb 20, 2017
Sold by
Kennedy William M
Bought by
Kennedy Meredith J
Purchase Details
Closed on
Sep 9, 1994
Sold by
Cook Homebuilders Inc
Bought by
Kennedy William M and Kennedy Meredith J
Purchase Details
Closed on
May 6, 1994
Sold by
Family Properties Inc
Bought by
Cook Homebuilders Inc
Purchase Details
Closed on
Nov 1, 1986
Bought by
Family Properties Inc
Purchase Details
Closed on
Sep 1, 1980
Create a Home Valuation Report for This Property
The Home Valuation Report is an in-depth analysis detailing your home's value as well as a comparison with similar homes in the area
Home Values in the Area
Average Home Value in this Area
Purchase History
| Date | Buyer | Sale Price | Title Company |
|---|---|---|---|
| Mccord Harvey James | -- | -- | |
| Mccord Harvey James | $130,000 | -- | |
| Kennedy Meredith J | -- | -- | |
| Kennedy William M | $84,800 | -- | |
| Cook Homebuilders Inc | $8,500 | -- | |
| Family Properties Inc | -- | -- | |
| -- | -- | -- |
Source: Public Records
Mortgage History
| Date | Status | Borrower | Loan Amount |
|---|---|---|---|
| Open | Mccord Harvey James | $127,645 | |
| Closed | Mccord Harvey James | $127,645 |
Source: Public Records
Tax History Compared to Growth
Tax History
| Year | Tax Paid | Tax Assessment Tax Assessment Total Assessment is a certain percentage of the fair market value that is determined by local assessors to be the total taxable value of land and additions on the property. | Land | Improvement |
|---|---|---|---|---|
| 2024 | $1,797 | $67,872 | $14,000 | $53,872 |
| 2023 | $1,569 | $59,524 | $10,000 | $49,524 |
| 2022 | $1,494 | $55,524 | $10,000 | $45,524 |
| 2021 | $1,578 | $54,320 | $10,000 | $44,320 |
| 2020 | $1,578 | $54,320 | $10,000 | $44,320 |
| 2019 | $1,568 | $54,404 | $3,600 | $50,804 |
| 2018 | $1,051 | $36,848 | $3,600 | $33,248 |
| 2017 | $1,051 | $36,848 | $3,600 | $33,248 |
| 2016 | $1,053 | $36,904 | $3,600 | $33,304 |
| 2015 | $1,055 | $36,904 | $3,600 | $33,304 |
| 2014 | $1,004 | $35,151 | $3,600 | $31,551 |
| 2013 | -- | $36,760 | $3,600 | $33,160 |
Source: Public Records
Map
Nearby Homes
- 127 Ashling Dr
- 104 Hidden Branches Ln
- 127 Oakmont Dr
- 91 Richmond Dr
- 105 Ridgeview Dr
- 118 Moss Creek Dr
- LOT 106 River Oaks Dr
- 209 River Oaks Dr
- 107 Windridge
- 109 Windridge
- 1784 New Franklin Rd
- 89 Chase Rd
- 107 Dixie Creek Dr
- 100 Creekside Dr Unit LOT 60A
- 117 Woodchase
- 129 Sunny Point Cir
- 106 S Chilton Crescent
- 201 S Chilton Crescent
- 203 S Chilton Crescent
- 134 S Page St
- 205 Englewood Dr
- 201 Englewood Dr
- 113 Rosalie Way
- 202 Englewood Dr
- 207 Englewood Dr
- 130 Meadowland Trail
- 204 Englewood Dr
- 200 Englewood Dr
- 111 Rosalie Way
- 110 Rosalie Way
- 128 Meadowland Trail
- 106 Englewood Dr
- 108 Rosalie Way
- 206 Englewood Dr
- 109 Rosalie Way
- 129 Meadowland Trail
- 106 Rosalie Way
- 107 Rosalie Way
- 127 Meadowland Trail
- 104 Englewood Dr