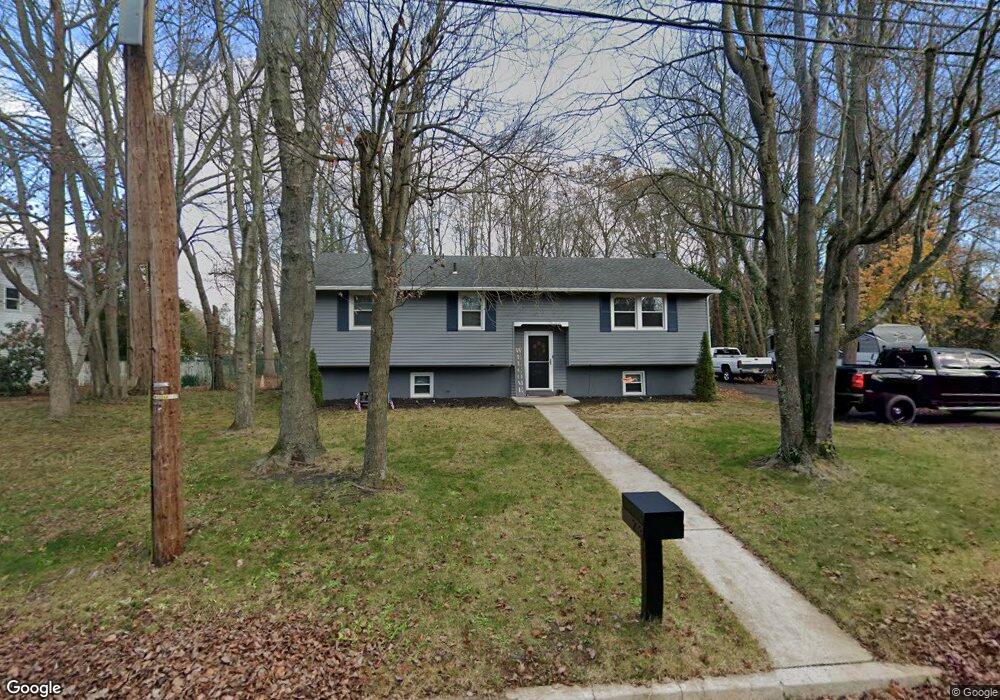
203 Franklin St Clayton, NJ 08312
Estimated Value: $342,000 - $382,000
4
Beds
2
Baths
2,104
Sq Ft
$171/Sq Ft
Est. Value
About This Home
This home is located at 203 Franklin St, Clayton, NJ 08312 and is currently estimated at $359,833, approximately $171 per square foot. 203 Franklin St is a home located in Gloucester County with nearby schools including Herma S. Simmons Elementary School, Clayton Middle School, and Clayton High School.
Ownership History
Date
Name
Owned For
Owner Type
Purchase Details
Closed on
Sep 12, 2011
Sold by
Osteen Paul
Bought by
Sharp Ryan S
Current Estimated Value
Home Financials for this Owner
Home Financials are based on the most recent Mortgage that was taken out on this home.
Original Mortgage
$165,803
Outstanding Balance
$114,190
Interest Rate
4.38%
Mortgage Type
New Conventional
Estimated Equity
$245,643
Purchase Details
Closed on
Sep 2, 2010
Sold by
Wells Fargo Bank N A
Bought by
Osteen Paul
Purchase Details
Closed on
Dec 30, 1998
Sold by
Bianco Thomas A and Bianco Marian Lynn
Bought by
Knox Connie M
Home Financials for this Owner
Home Financials are based on the most recent Mortgage that was taken out on this home.
Original Mortgage
$70,000
Interest Rate
6.74%
Mortgage Type
Stand Alone First
Purchase Details
Closed on
Apr 16, 1997
Sold by
Bianco Thomas A and Bianco Deborah Jo
Bought by
Bianco Thomas A
Create a Home Valuation Report for This Property
The Home Valuation Report is an in-depth analysis detailing your home's value as well as a comparison with similar homes in the area
Home Values in the Area
Average Home Value in this Area
Purchase History
| Date | Buyer | Sale Price | Title Company |
|---|---|---|---|
| Sharp Ryan S | $160,000 | Connection Title Agency Nj L | |
| Osteen Paul | $89,000 | Coastal Title Agency Inc | |
| Knox Connie M | $96,000 | Dominion Title Services Inc | |
| Bianco Thomas A | -- | -- |
Source: Public Records
Mortgage History
| Date | Status | Borrower | Loan Amount |
|---|---|---|---|
| Open | Sharp Ryan S | $165,803 | |
| Previous Owner | Knox Connie M | $70,000 |
Source: Public Records
Tax History Compared to Growth
Tax History
| Year | Tax Paid | Tax Assessment Tax Assessment Total Assessment is a certain percentage of the fair market value that is determined by local assessors to be the total taxable value of land and additions on the property. | Land | Improvement |
|---|---|---|---|---|
| 2025 | $7,225 | $291,900 | $72,700 | $219,200 |
| 2024 | $7,225 | $291,900 | $72,700 | $219,200 |
| 2023 | $6,631 | $164,100 | $31,500 | $132,600 |
| 2022 | $6,559 | $164,100 | $31,500 | $132,600 |
| 2021 | $6,324 | $164,100 | $31,500 | $132,600 |
| 2020 | $6,493 | $164,100 | $31,500 | $132,600 |
| 2019 | $6,383 | $164,100 | $31,500 | $132,600 |
| 2018 | $6,293 | $164,100 | $31,500 | $132,600 |
| 2017 | $6,187 | $164,100 | $31,500 | $132,600 |
| 2016 | $6,024 | $161,500 | $31,500 | $130,000 |
| 2015 | $5,846 | $161,500 | $31,500 | $130,000 |
| 2014 | $5,643 | $161,500 | $31,500 | $130,000 |
Source: Public Records
Map
Nearby Homes
- 760 W Clayton Ave
- 745 W Clayton Ave
- 904 Pine Ave
- 238 W Center St
- 125 W Clayton Ave
- 196 Jerrys Ave
- 100 Jerrys Ave
- 237 S Delsea Dr
- 100 Aura Rd Unit 112
- 100 Aura Rd Unit 212
- 100 Aura Rd Unit 311
- 100 Aura Rd Unit 111
- 100 Aura Rd Unit 110
- 211 Hollywood Ave
- 710 Webster Dr
- 131 W Clinton St
- 124 W Howard St
- 26 Silver Lake Dr
- 320 E Clayton Ave
- 7 Hawthorn Way
- 201 Franklin St
- 212 Franklin St
- 215 Franklin St
- 214 Franklin St
- 302 Roosevelt Blvd
- 500 W Chestnut St
- 217 Franklin St
- 545 Laver Ave
- 199 Franklin St
- 300 Roosevelt Blvd
- 415 W Chestnut St
- 216 Franklin St
- 605 May Ave
- 532 Laver Ave
- 408 Roosevelt Blvd
- 182 Franklin St
- 401 W Chestnut St
- 707 May Ave
- 197 Franklin St
- 458 Roosevelt Blvd