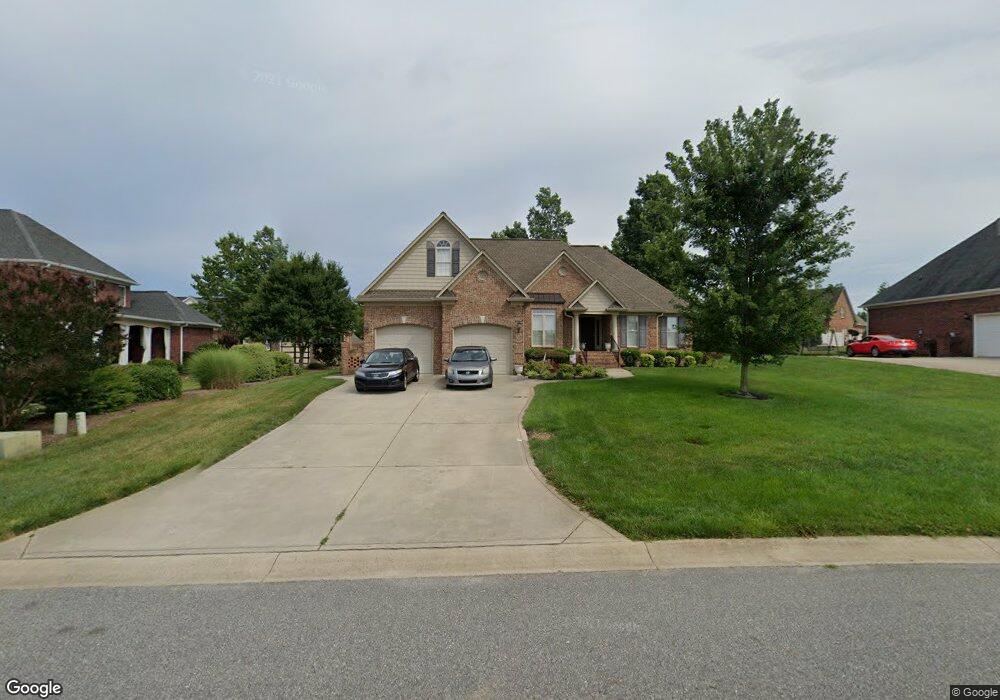
203 Hall Crossing Kings Mountain, NC 28086
Estimated Value: $409,738 - $526,000
3
Beds
3
Baths
2,217
Sq Ft
$213/Sq Ft
Est. Value
About This Home
This home is located at 203 Hall Crossing, Kings Mountain, NC 28086 and is currently estimated at $471,935, approximately $212 per square foot. 203 Hall Crossing is a home located in Cleveland County with nearby schools including West Elementary School, Kings Mountain Middle, and Kings Mountain Intermediate School.
Ownership History
Date
Name
Owned For
Owner Type
Purchase Details
Closed on
Jul 29, 2011
Sold by
Bridges Barbara H and Bridges Glee
Bought by
Roberts Edgar E and Roberts Shannon C
Current Estimated Value
Home Financials for this Owner
Home Financials are based on the most recent Mortgage that was taken out on this home.
Original Mortgage
$227,979
Outstanding Balance
$157,555
Interest Rate
4.53%
Mortgage Type
New Conventional
Estimated Equity
$314,380
Purchase Details
Closed on
Nov 21, 2008
Sold by
Hall Builders Inc
Bought by
Devane Barbara H
Home Financials for this Owner
Home Financials are based on the most recent Mortgage that was taken out on this home.
Original Mortgage
$105,500
Interest Rate
5.89%
Mortgage Type
Purchase Money Mortgage
Create a Home Valuation Report for This Property
The Home Valuation Report is an in-depth analysis detailing your home's value as well as a comparison with similar homes in the area
Home Values in the Area
Average Home Value in this Area
Purchase History
| Date | Buyer | Sale Price | Title Company |
|---|---|---|---|
| Roberts Edgar E | $220,000 | None Available | |
| Devane Barbara H | $255,000 | None Available |
Source: Public Records
Mortgage History
| Date | Status | Borrower | Loan Amount |
|---|---|---|---|
| Open | Roberts Edgar E | $227,979 | |
| Previous Owner | Devane Barbara H | $105,500 |
Source: Public Records
Tax History Compared to Growth
Tax History
| Year | Tax Paid | Tax Assessment Tax Assessment Total Assessment is a certain percentage of the fair market value that is determined by local assessors to be the total taxable value of land and additions on the property. | Land | Improvement |
|---|---|---|---|---|
| 2025 | $4,735 | $461,905 | $44,289 | $417,616 |
| 2024 | $3,787 | $322,240 | $31,635 | $290,605 |
| 2023 | $3,768 | $322,240 | $31,635 | $290,605 |
| 2022 | $3,608 | $322,240 | $31,635 | $290,605 |
| 2021 | $3,626 | $322,240 | $31,635 | $290,605 |
| 2020 | $2,989 | $258,032 | $31,635 | $226,397 |
| 2019 | $2,989 | $258,032 | $31,635 | $226,397 |
| 2018 | $2,988 | $258,032 | $31,635 | $226,397 |
| 2017 | $2,973 | $258,032 | $31,635 | $226,397 |
| 2016 | $2,986 | $258,032 | $31,635 | $226,397 |
| 2015 | $2,760 | $244,811 | $18,981 | $225,830 |
| 2014 | $2,760 | $244,811 | $18,981 | $225,830 |
Source: Public Records
Map
Nearby Homes
- 312 Wintergreen Ct
- 112 Fulton Dr
- 402 Scotland Dr
- 417 Phifer Rd
- 430 Fulton Dr
- 442 Phifer Rd
- 440 Phifer Rd
- 804 Lee St
- 811 W Gold St Unit 26
- 811 W Gold St Unit 15
- 0 Southridge Dr Unit CAR4298120
- 410 S Cansler St
- 1301 Shelby Rd
- 227 Paige Rd
- 400 S Cansler St
- 208 Victoria Cir
- 212 Paige Rd
- 112 Parker Claire Ln
- 316 S Cansler St
- 149 Parker Claire Ln
- 205 Hall Crossing
- 215 Wintergreen Ct
- 211 Wintergreen Ct
- 212 Kaitlyn Ln
- 301 Wintergreen Ct
- 224 Kaitlyn Ln
- 218 Kaitlyn Ln
- 208 Kaitlyn Ln
- 202 Hall Crossing
- 207 Wintergreen Ct
- 302 Kaitlyn Ln
- 305 Wintergreen Ct
- 204 Kaitlyn Ln
- 216 Wintergreen Ct
- 212 Wintergreen Ct
- 300 Wintergreen Ct
- 205 Wintergreen Ct
- 306 Kaitlyn Ln
- 208 Wintergreen Ct
- 309 Wintergreen Ct