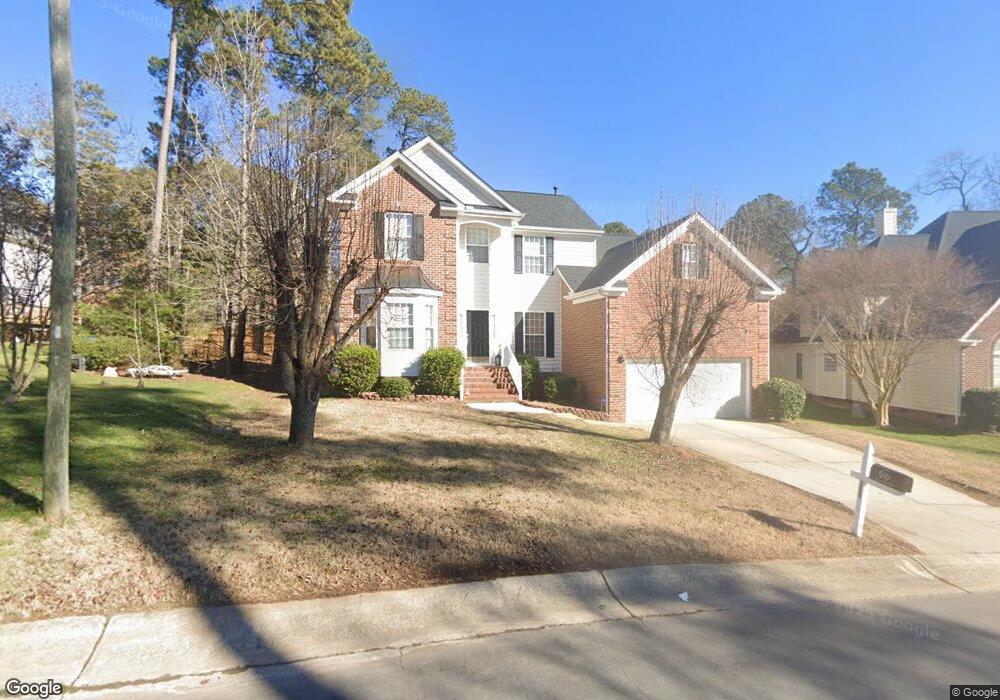
203 Landreth Ct Durham, NC 27713
South Durham NeighborhoodEstimated Value: $533,000 - $594,000
4
Beds
3
Baths
2,570
Sq Ft
$222/Sq Ft
Est. Value
About This Home
This home is located at 203 Landreth Ct, Durham, NC 27713 and is currently estimated at $570,078, approximately $221 per square foot. 203 Landreth Ct is a home located in Durham County with nearby schools including Lowe's Grove Middle, Hillside High School, and Kestrel Heights School.
Ownership History
Date
Name
Owned For
Owner Type
Purchase Details
Closed on
Aug 19, 2015
Sold by
Spears Sandra
Bought by
Qauyum Abdul and Qauyum Mahjabeen F
Current Estimated Value
Purchase Details
Closed on
Jul 8, 2014
Sold by
Spears Sandra and Spears David Joseph
Bought by
Spears Sandra
Purchase Details
Closed on
Mar 20, 2007
Sold by
Poindexter Sharon R and Poindexter Rodney E
Bought by
Spears Sandra
Home Financials for this Owner
Home Financials are based on the most recent Mortgage that was taken out on this home.
Original Mortgage
$265,110
Interest Rate
5.68%
Mortgage Type
FHA
Purchase Details
Closed on
Feb 23, 2001
Sold by
Centex Homes
Bought by
Poindexter Rodney E and Poindexter Sharon R
Home Financials for this Owner
Home Financials are based on the most recent Mortgage that was taken out on this home.
Original Mortgage
$221,550
Interest Rate
10.85%
Create a Home Valuation Report for This Property
The Home Valuation Report is an in-depth analysis detailing your home's value as well as a comparison with similar homes in the area
Home Values in the Area
Average Home Value in this Area
Purchase History
| Date | Buyer | Sale Price | Title Company |
|---|---|---|---|
| Qauyum Abdul | $224,500 | Attorney | |
| Spears Sandra | -- | None Available | |
| Spears Sandra | $268,000 | None Available | |
| Poindexter Rodney E | $233,500 | -- |
Source: Public Records
Mortgage History
| Date | Status | Borrower | Loan Amount |
|---|---|---|---|
| Previous Owner | Spears Sandra | $265,110 | |
| Previous Owner | Poindexter Rodney E | $221,550 |
Source: Public Records
Tax History
| Year | Tax Paid | Tax Assessment Tax Assessment Total Assessment is a certain percentage of the fair market value that is determined by local assessors to be the total taxable value of land and additions on the property. | Land | Improvement |
|---|---|---|---|---|
| 2025 | $5,409 | $545,622 | $144,525 | $401,097 |
| 2024 | $4,149 | $316,774 | $67,650 | $249,124 |
| 2023 | $4,149 | $316,774 | $67,650 | $249,124 |
| 2022 | $4,054 | $316,774 | $67,650 | $249,124 |
| 2021 | $4,035 | $316,774 | $67,650 | $249,124 |
| 2020 | $3,940 | $316,774 | $67,650 | $249,124 |
| 2019 | $3,940 | $331,713 | $67,650 | $264,063 |
| 2018 | $3,599 | $265,347 | $39,975 | $225,372 |
| 2017 | $3,573 | $265,347 | $39,975 | $225,372 |
| 2016 | $3,452 | $293,056 | $39,975 | $253,081 |
| 2015 | $3,914 | $282,759 | $50,306 | $232,453 |
| 2014 | $3,914 | $282,759 | $50,306 | $232,453 |
Source: Public Records
Map
Nearby Homes
- 903 Limerick Ln
- 4517 Grandale Dr
- 1021 Pondfield Way
- 1 Haycox Ct
- 7 Monteith Ct
- 43 Redbud Ct
- 109 Settlers Mill Ln
- 620 Wellingham Dr
- 111 Wenonah Way
- 1019 Catch Fly Ln
- 211 Cool Spring Rd
- 7 Scenic Ct
- 1022 Orchard Grass Rd
- 1215 Lotus Lilly Dr
- 124 Wicklow Ln
- 1027 Orchard Grass Rd
- 1203 Lotus Lilly Dr
- 515 Wellingham Dr
- 1049 Laceflower Dr
- 6608 Rossford Ln
- 302 Shalimar Dr
- 306 Shalimar Dr
- 232 Shalimar Dr
- 207 Landreth Ct
- 206 Landreth Ct
- 902 Limerick Ln
- 904 Limerick Ln
- 230 Shalimar Dr
- 209 Landreth Ct
- 208 Landreth Ct
- 4625 Grandale Dr
- 901 Limerick Ln
- 303 Shalimar Dr
- 305 Shalimar Dr
- 235 Shalimar Dr
- 4624 Grandale Dr
- 906 Limerick Ln
- 105 Landreth Ct
- 228 Shalimar Dr
- 211 Landreth Ct
Your Personal Tour Guide
Ask me questions while you tour the home.