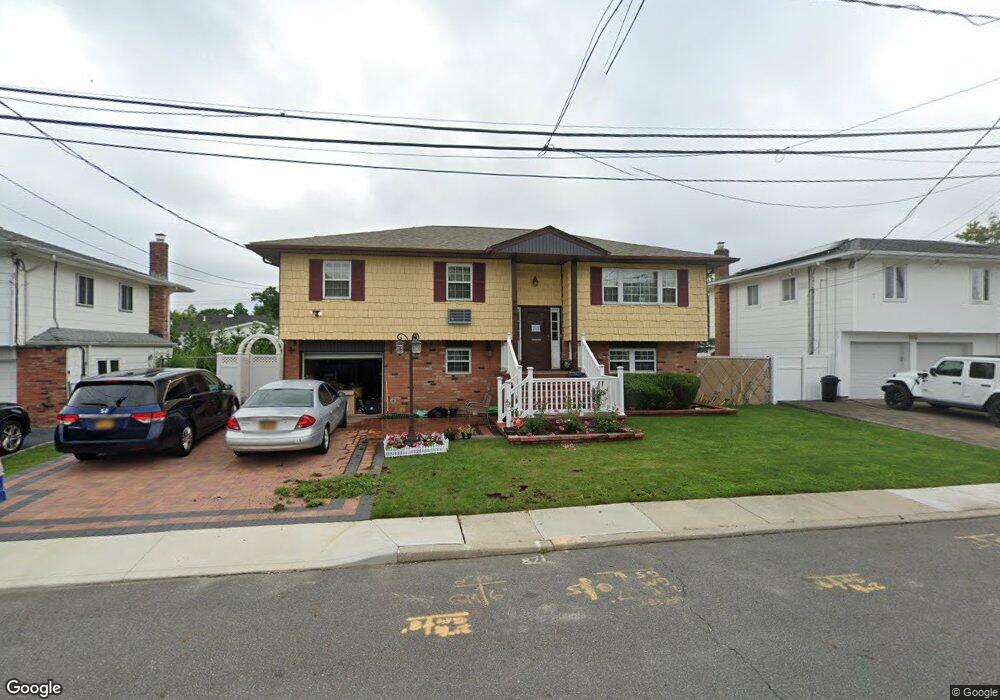
203 Main Pkwy W Plainview, NY 11803
Estimated Value: $911,000 - $1,054,053
--
Bed
3
Baths
1,264
Sq Ft
$777/Sq Ft
Est. Value
About This Home
This home is located at 203 Main Pkwy W, Plainview, NY 11803 and is currently estimated at $982,527, approximately $777 per square foot. 203 Main Pkwy W is a home located in Nassau County with nearby schools including Stratford Road School, H B Mattlin Middle School, and Plainview-Old Bethpage John F. Kennedy High School.
Ownership History
Date
Name
Owned For
Owner Type
Purchase Details
Closed on
Jul 6, 2016
Sold by
Chakravarti Deb N and Narayan Deb
Bought by
Chakravarti Deb Narayan and Chakravarti Bulbul
Current Estimated Value
Purchase Details
Closed on
Apr 29, 2010
Sold by
All State Properties Llc
Bought by
Chakravarti Deb N and Chakravarti Bulbul
Home Financials for this Owner
Home Financials are based on the most recent Mortgage that was taken out on this home.
Original Mortgage
$300,000
Interest Rate
4.44%
Mortgage Type
Purchase Money Mortgage
Purchase Details
Closed on
Apr 20, 2007
Sold by
Brijlal Vejai
Bought by
Ganesh Ramnarine
Purchase Details
Closed on
Nov 21, 2006
Sold by
Franks New York Construct
Purchase Details
Closed on
Nov 10, 2006
Sold by
Fremont Investment & Loan
Bought by
Franks New York Construct
Purchase Details
Closed on
Feb 20, 2004
Sold by
Fritz Mary
Bought by
Dominquez Dioni
Create a Home Valuation Report for This Property
The Home Valuation Report is an in-depth analysis detailing your home's value as well as a comparison with similar homes in the area
Home Values in the Area
Average Home Value in this Area
Purchase History
| Date | Buyer | Sale Price | Title Company |
|---|---|---|---|
| Chakravarti Deb Narayan | -- | None Available | |
| Chakravarti Deb N | $455,000 | -- | |
| Ganesh Ramnarine | $690,000 | -- | |
| -- | -- | -- | |
| Franks New York Construct | $525,000 | -- | |
| Dominquez Dioni | $495,000 | -- |
Source: Public Records
Mortgage History
| Date | Status | Borrower | Loan Amount |
|---|---|---|---|
| Closed | Chakravarti Deb N | $300,000 |
Source: Public Records
Tax History Compared to Growth
Tax History
| Year | Tax Paid | Tax Assessment Tax Assessment Total Assessment is a certain percentage of the fair market value that is determined by local assessors to be the total taxable value of land and additions on the property. | Land | Improvement |
|---|---|---|---|---|
| 2025 | $16,013 | $573 | $271 | $302 |
| 2024 | $4,771 | $576 | $272 | $304 |
| 2023 | $14,102 | $603 | $285 | $318 |
| 2022 | $14,102 | $603 | $285 | $318 |
| 2021 | $13,165 | $603 | $285 | $318 |
| 2020 | $12,216 | $634 | $633 | $1 |
| 2019 | $10,670 | $679 | $674 | $5 |
| 2018 | $10,764 | $725 | $0 | $0 |
| 2017 | $7,252 | $770 | $679 | $91 |
| 2016 | $11,086 | $816 | $646 | $170 |
| 2015 | $3,865 | $861 | $559 | $302 |
| 2014 | $3,865 | $861 | $559 | $302 |
| 2013 | $3,720 | $910 | $591 | $319 |
Source: Public Records
Map
Nearby Homes
- 29 Oak Dr
- 21 Carol St
- 109 Cherry Dr W
- 122 Southern Pkwy
- 3 Wood Ln
- 113 Northern Pkwy W
- 14 Judith St
- 14 Hollyberry Rd
- 32 Jerold St
- 94 Phipps Ln
- 43 Acorn Ln
- 58 Pasadena Dr
- 91 Westbury Ave
- 48 Knickerbocker Rd E
- 98 Virginia Ave
- 60 Westbury Ave
- 81 Audrey Ave
- 50 Southern Pkwy
- 33 Shelter Hill Rd
- 39 Ontario Ave