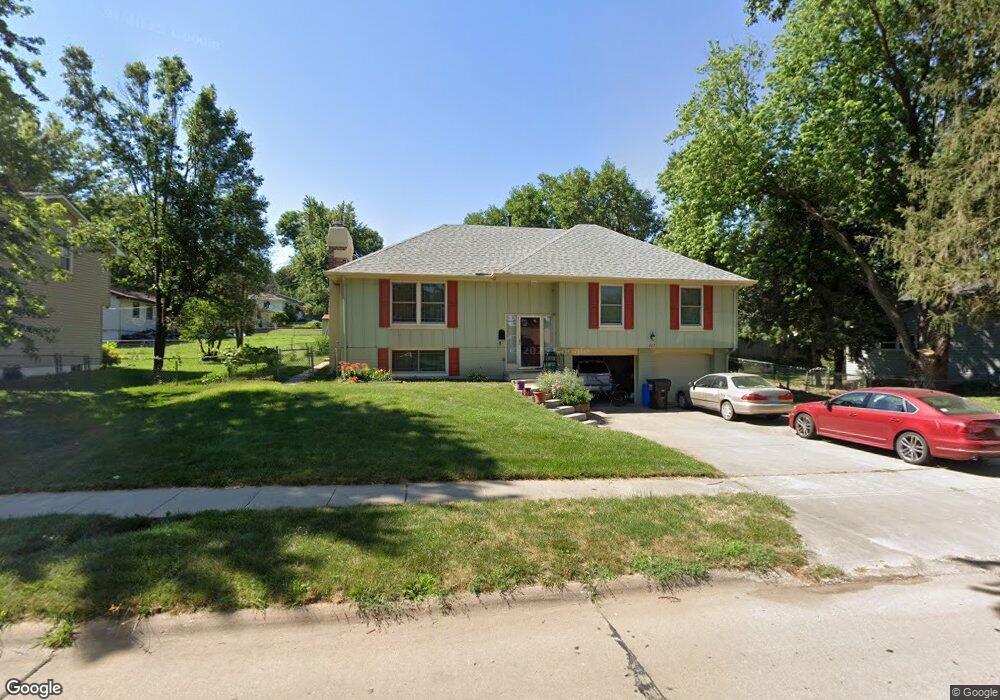
203 Matthies Dr Papillion, NE 68046
Estimated Value: $281,000 - $328,000
3
Beds
5
Baths
1,972
Sq Ft
$153/Sq Ft
Est. Value
About This Home
This home is located at 203 Matthies Dr, Papillion, NE 68046 and is currently estimated at $300,870, approximately $152 per square foot. 203 Matthies Dr is a home located in Sarpy County with nearby schools including Carriage Hill Elementary School, Papillion Middle School, and Papillion La Vista South High School.
Ownership History
Date
Name
Owned For
Owner Type
Purchase Details
Closed on
Oct 4, 2016
Sold by
Smith David and Smith Sharon
Bought by
Cole Erik R and Cole Glenda V
Current Estimated Value
Home Financials for this Owner
Home Financials are based on the most recent Mortgage that was taken out on this home.
Original Mortgage
$132,000
Outstanding Balance
$105,756
Interest Rate
3.44%
Mortgage Type
New Conventional
Estimated Equity
$195,114
Purchase Details
Closed on
Apr 30, 2003
Sold by
Clear Blue Skies Properties Llc
Bought by
Smith David and Smith Sharon
Home Financials for this Owner
Home Financials are based on the most recent Mortgage that was taken out on this home.
Original Mortgage
$139,050
Interest Rate
5.87%
Mortgage Type
VA
Purchase Details
Closed on
Dec 12, 2002
Sold by
Worden Joan and Worden Raymond F
Bought by
B & B Properties Llc
Purchase Details
Closed on
Nov 8, 2002
Sold by
Telecky Mark A and Telecky Susan E
Bought by
Worden Joan
Create a Home Valuation Report for This Property
The Home Valuation Report is an in-depth analysis detailing your home's value as well as a comparison with similar homes in the area
Home Values in the Area
Average Home Value in this Area
Purchase History
| Date | Buyer | Sale Price | Title Company |
|---|---|---|---|
| Cole Erik R | $165,000 | None Available | |
| Smith David | $135,000 | Midlands Land Title & Abstra | |
| B & B Properties Llc | -- | Dakota Title & Escrow Co | |
| Worden Joan | $85,000 | Dakota Title & Escrow Co |
Source: Public Records
Mortgage History
| Date | Status | Borrower | Loan Amount |
|---|---|---|---|
| Open | Cole Erik R | $132,000 | |
| Previous Owner | Smith David | $139,050 |
Source: Public Records
Tax History Compared to Growth
Tax History
| Year | Tax Paid | Tax Assessment Tax Assessment Total Assessment is a certain percentage of the fair market value that is determined by local assessors to be the total taxable value of land and additions on the property. | Land | Improvement |
|---|---|---|---|---|
| 2025 | $4,089 | $281,486 | $36,000 | $245,486 |
| 2024 | $4,259 | $270,298 | $35,000 | $235,298 |
| 2023 | $4,259 | $226,178 | $30,000 | $196,178 |
| 2022 | $4,282 | $209,805 | $27,000 | $182,805 |
| 2021 | $3,911 | $187,851 | $21,000 | $166,851 |
| 2020 | $3,806 | $181,013 | $21,000 | $160,013 |
| 2019 | $3,452 | $164,280 | $21,000 | $143,280 |
| 2018 | $3,312 | $155,219 | $19,000 | $136,219 |
| 2017 | $3,065 | $143,664 | $19,000 | $124,664 |
| 2016 | $2,845 | $133,564 | $19,000 | $114,564 |
| 2015 | $2,753 | $129,625 | $19,000 | $110,625 |
| 2014 | $2,884 | $134,890 | $19,000 | $115,890 |
| 2012 | -- | $133,454 | $19,000 | $114,454 |
Source: Public Records
Map
Nearby Homes
- 1120 Delmar St Unit 4B
- 1118 S Grandview Ave
- 1126 Hackney Dr
- 308 Crest Rd
- 704 Valley Rd
- Lot 52 Unit Lot 52
- Lot 289 Granite Lake
- LOT 293 Granite Lake
- 613 Valley Rd
- Lot 71 N Shore Commercial
- Lot 39
- 1111 Laport Dr
- 12378 Lake Vista Dr
- 262 Ashbury Hills St
- 259 Ashbury Hils St
- 235 Lot St
- Lot 28 Ashbury Hills
- 906 Chisholm Trail
- 309 S Fillmore St
- 907 Woodland Ave