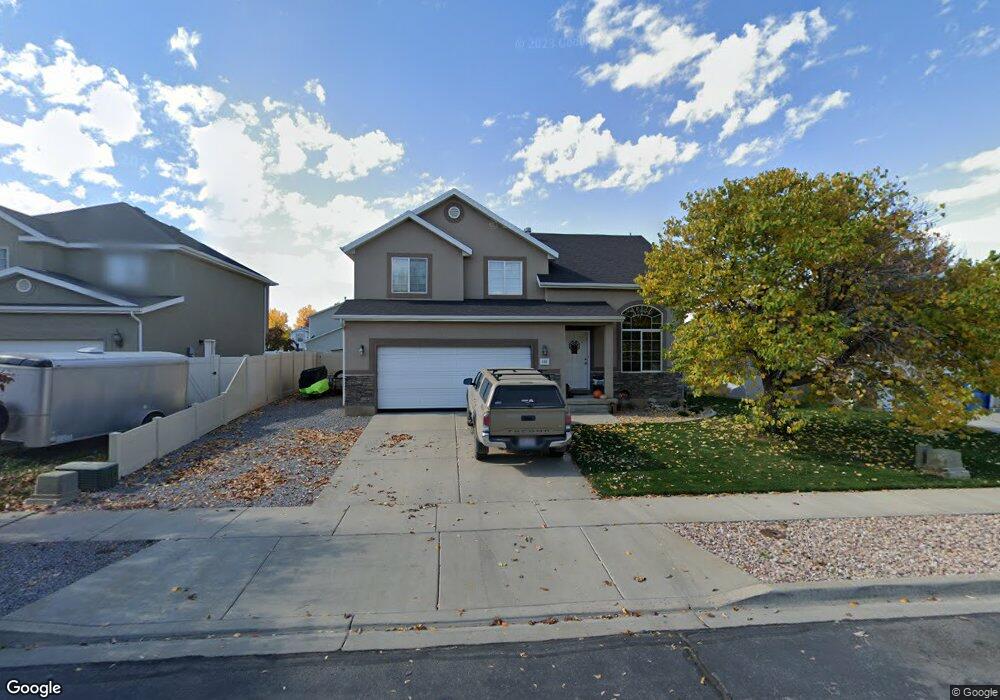
203 N 680 W Spanish Fork, UT 84660
Estimated Value: $462,000 - $503,000
3
Beds
2
Baths
1,936
Sq Ft
$246/Sq Ft
Est. Value
About This Home
This home is located at 203 N 680 W, Spanish Fork, UT 84660 and is currently estimated at $476,941, approximately $246 per square foot. 203 N 680 W is a home located in Utah County with nearby schools including Brockbank Elementary School, Spanish Fork Jr High School, and Spanish Fork High School.
Ownership History
Date
Name
Owned For
Owner Type
Purchase Details
Closed on
Jan 13, 2005
Sold by
Salisbury Development Lc
Bought by
Emerine Stacy L
Current Estimated Value
Home Financials for this Owner
Home Financials are based on the most recent Mortgage that was taken out on this home.
Original Mortgage
$158,561
Outstanding Balance
$79,737
Interest Rate
5.69%
Mortgage Type
FHA
Estimated Equity
$397,204
Purchase Details
Closed on
Sep 16, 2004
Sold by
Mtm Ltd
Bought by
Salisbury Development Lc
Create a Home Valuation Report for This Property
The Home Valuation Report is an in-depth analysis detailing your home's value as well as a comparison with similar homes in the area
Home Values in the Area
Average Home Value in this Area
Purchase History
| Date | Buyer | Sale Price | Title Company |
|---|---|---|---|
| Emerine Stacy L | -- | Provo Land Title Co | |
| Salisbury Development Lc | -- | Provo Land Title Co |
Source: Public Records
Mortgage History
| Date | Status | Borrower | Loan Amount |
|---|---|---|---|
| Open | Emerine Stacy L | $158,561 | |
| Closed | Salisbury Development Lc | $0 |
Source: Public Records
Tax History Compared to Growth
Tax History
| Year | Tax Paid | Tax Assessment Tax Assessment Total Assessment is a certain percentage of the fair market value that is determined by local assessors to be the total taxable value of land and additions on the property. | Land | Improvement |
|---|---|---|---|---|
| 2025 | $2,222 | $245,245 | $191,900 | $254,000 |
| 2024 | $2,222 | $229,075 | $0 | $0 |
| 2023 | $2,297 | $236,995 | $0 | $0 |
| 2022 | $2,333 | $236,060 | $0 | $0 |
| 2021 | $1,968 | $318,600 | $114,600 | $204,000 |
| 2020 | $1,830 | $288,000 | $104,200 | $183,800 |
| 2019 | $1,701 | $281,700 | $97,900 | $183,800 |
| 2018 | $1,531 | $245,100 | $85,300 | $159,800 |
| 2017 | $1,464 | $125,950 | $0 | $0 |
| 2016 | $1,471 | $124,905 | $0 | $0 |
| 2015 | $1,467 | $123,035 | $0 | $0 |
| 2014 | $1,272 | $107,085 | $0 | $0 |
Source: Public Records
Map
Nearby Homes
- 1788 N 630 St W Unit 47
- 1826 N 630 St W Unit 101
- 1841 N 630 St W Unit 71
- 833 W 250 N
- 226 N 860 W Unit 156
- 13 N 710 W
- 1040 W Center St
- 956 W 40 N
- 393 N 400 W
- 88 S 400 W
- 903 W 100 S
- 294 W 200 N
- 134 N 300 W
- 559 N Mitchell Dr
- 231 S 880 W
- 2645 W 360 S Unit 1
- 2576 W 360 S Unit 5
- 1026 W 350 S
- 433 N 100 W
- 225 W 300 S