Estimated Value: $81,000 - $131,000
3
Beds
1
Bath
1,664
Sq Ft
$62/Sq Ft
Est. Value
About This Home
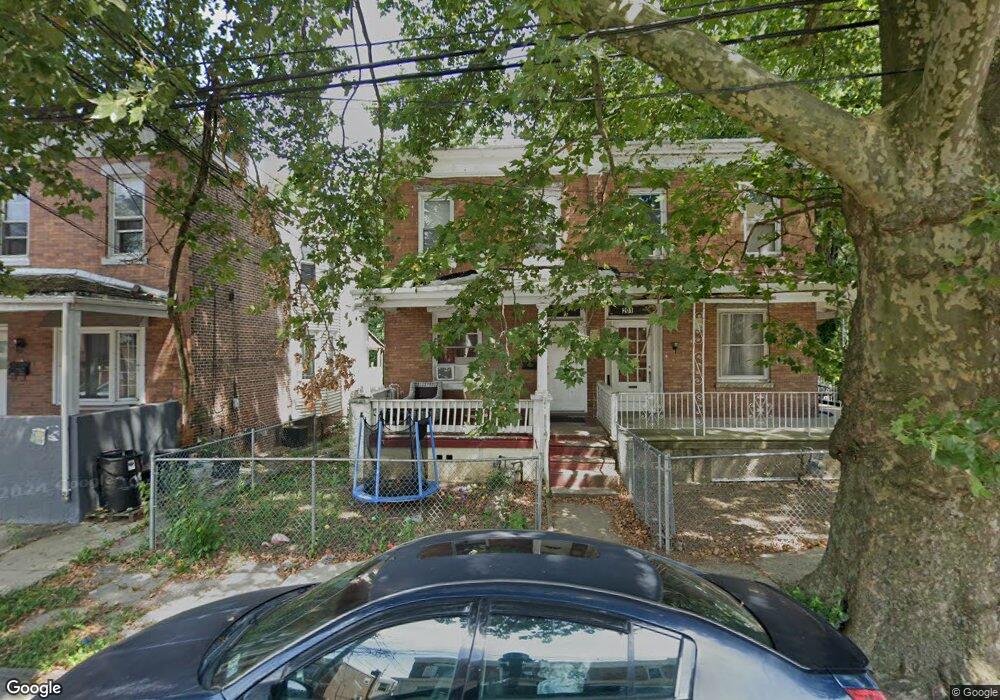
This home is located at 203 N Front St, Darby, PA 19023 and is currently estimated at $102,995, approximately $61 per square foot. 203 N Front St is a home located in Delaware County with nearby schools including Bell Avenue Elementary School, Penn Wood Middle School, and Penn Wood High School - Cypress Street Campus.
Ownership History
Date
Name
Owned For
Owner Type
Purchase Details
Closed on
Sep 27, 2024
Sold by
Shire International Corp
Bought by
King Ayscia
Current Estimated Value
Purchase Details
Closed on
Oct 21, 2019
Sold by
Dahnsaw Hawa Z
Bought by
Shire International Corp
Purchase Details
Closed on
Jan 10, 2018
Sold by
Shire International Corp
Bought by
Dahnsan Hawa Z
Purchase Details
Closed on
Feb 21, 2007
Sold by
Tri State Properties Inc
Bought by
Shire International Corp
Purchase Details
Closed on
Dec 9, 2004
Sold by
Duncan Gumlan
Bought by
Tristate Properties Inc
Purchase Details
Closed on
Aug 6, 1997
Sold by
Hud
Bought by
Duncan Gumlan
Purchase Details
Closed on
Dec 4, 1996
Sold by
Osborne Ann
Bought by
Cenlar Fsb
Purchase Details
Closed on
Nov 26, 1996
Sold by
Cenlar Fsb
Bought by
Hud
Create a Home Valuation Report for This Property
The Home Valuation Report is an in-depth analysis detailing your home's value as well as a comparison with similar homes in the area
Home Values in the Area
Average Home Value in this Area
Purchase History
| Date | Buyer | Sale Price | Title Company |
|---|---|---|---|
| King Ayscia | $80,000 | None Listed On Document | |
| King Ayscia | $80,000 | None Listed On Document | |
| Shire International Corp | $40,000 | None Available | |
| Dahnsan Hawa Z | $24,000 | None Available | |
| Shire International Corp | $43,000 | None Available | |
| Tristate Properties Inc | $14,135 | -- | |
| Duncan Gumlan | $20,001 | Commonwealth Land Title Ins | |
| Cenlar Fsb | -- | -- | |
| Hud | -- | -- |
Source: Public Records
Tax History Compared to Growth
Tax History
| Year | Tax Paid | Tax Assessment Tax Assessment Total Assessment is a certain percentage of the fair market value that is determined by local assessors to be the total taxable value of land and additions on the property. | Land | Improvement |
|---|---|---|---|---|
| 2025 | $3,327 | $67,180 | $20,120 | $47,060 |
| 2024 | $3,327 | $67,180 | $20,120 | $47,060 |
| 2023 | $3,130 | $67,180 | $20,120 | $47,060 |
| 2022 | $3,045 | $67,180 | $20,120 | $47,060 |
| 2021 | $4,248 | $67,180 | $20,120 | $47,060 |
| 2020 | $2,703 | $37,000 | $12,640 | $24,360 |
| 2019 | $2,588 | $37,000 | $12,640 | $24,360 |
| 2018 | $2,557 | $37,000 | $0 | $0 |
| 2017 | $2,510 | $37,000 | $0 | $0 |
| 2016 | $207 | $37,000 | $0 | $0 |
| 2015 | $207 | $37,000 | $0 | $0 |
| 2014 | $207 | $37,000 | $0 | $0 |
Source: Public Records
Map
Nearby Homes
- 205 N Front St
- 22 N Front St
- 133 N 3rd St
- 2205-7 Island Rd
- 7269 Saybrook Ave
- 306 Berbro St
- 323 Berbro St
- 7119 Woodland Ave
- 25 S Front St
- 210 Londonderry Ln
- 7036 Greenway Ave
- 422 Darby Terrance Terrace
- 443 Darby Terrace
- 104 S 3rd St
- 2239 S 71st St
- 7053 Paschall Ave
- 7018 Woodland Ave
- 7016 Woodland Ave
- 7014 Woodland Ave
- 214 S 2nd St
- 201 N Front St
- 207 N Front St
- 209 N Front St
- 211 N Front St
- 0 N Front St Unit 6108109
- 0 N Front St Unit PADE536452
- 127 N Front St
- 125 N Front St
- 200 N Front St
- 202 N Front St
- 204 N Front St
- 123 N Front St
- 206 N Front St
- 208 N Front St
- 210 N Front St
- 121 N Front St
- 126 N Front St
- 214 N Front St
- 119 N Front St
- 124 N Front St