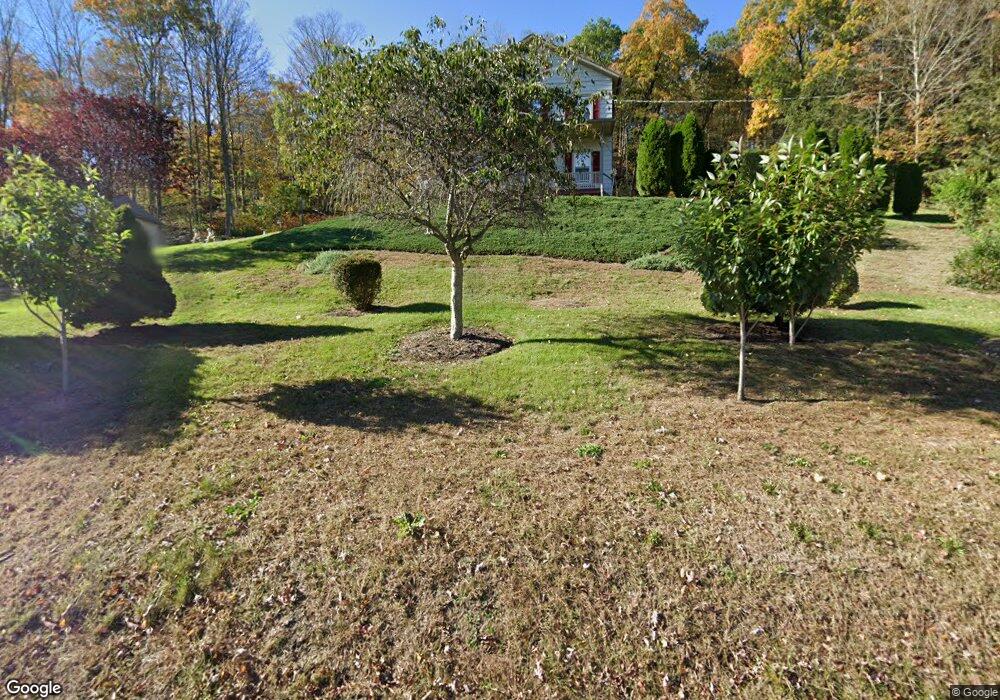
203 N Main St Thomaston, CT 06787
Estimated Value: $274,000 - $384,000
3
Beds
2
Baths
1,947
Sq Ft
$181/Sq Ft
Est. Value
About This Home
This home is located at 203 N Main St, Thomaston, CT 06787 and is currently estimated at $353,362, approximately $181 per square foot. 203 N Main St is a home located in Litchfield County with nearby schools including Black Rock School, Thomaston Center School, and Thomaston High School.
Ownership History
Date
Name
Owned For
Owner Type
Purchase Details
Closed on
Nov 26, 2001
Sold by
Quirk Patrick and Winslow Karin
Bought by
Galvin William and Galvin Grace
Current Estimated Value
Home Financials for this Owner
Home Financials are based on the most recent Mortgage that was taken out on this home.
Original Mortgage
$166,250
Outstanding Balance
$64,625
Interest Rate
6.5%
Estimated Equity
$288,737
Create a Home Valuation Report for This Property
The Home Valuation Report is an in-depth analysis detailing your home's value as well as a comparison with similar homes in the area
Home Values in the Area
Average Home Value in this Area
Purchase History
| Date | Buyer | Sale Price | Title Company |
|---|---|---|---|
| Galvin William | $175,000 | -- |
Source: Public Records
Mortgage History
| Date | Status | Borrower | Loan Amount |
|---|---|---|---|
| Open | Galvin William | $92,000 | |
| Open | Galvin William | $166,250 |
Source: Public Records
Tax History Compared to Growth
Tax History
| Year | Tax Paid | Tax Assessment Tax Assessment Total Assessment is a certain percentage of the fair market value that is determined by local assessors to be the total taxable value of land and additions on the property. | Land | Improvement |
|---|---|---|---|---|
| 2025 | $5,806 | $162,120 | $46,060 | $116,060 |
| 2024 | $5,570 | $162,120 | $46,060 | $116,060 |
| 2023 | $5,452 | $162,120 | $46,060 | $116,060 |
| 2022 | $5,206 | $162,120 | $46,060 | $116,060 |
| 2021 | $4,613 | $127,680 | $46,060 | $81,620 |
| 2020 | $4,613 | $127,680 | $46,060 | $81,620 |
| 2019 | $4,664 | $127,680 | $46,060 | $81,620 |
| 2018 | $4,570 | $127,680 | $46,060 | $81,620 |
| 2017 | $4,475 | $127,680 | $46,060 | $81,620 |
| 2016 | $4,491 | $131,810 | $46,060 | $85,750 |
| 2015 | $4,433 | $131,810 | $46,060 | $85,750 |
| 2014 | $4,433 | $131,810 | $46,060 | $85,750 |
Source: Public Records
Map
Nearby Homes