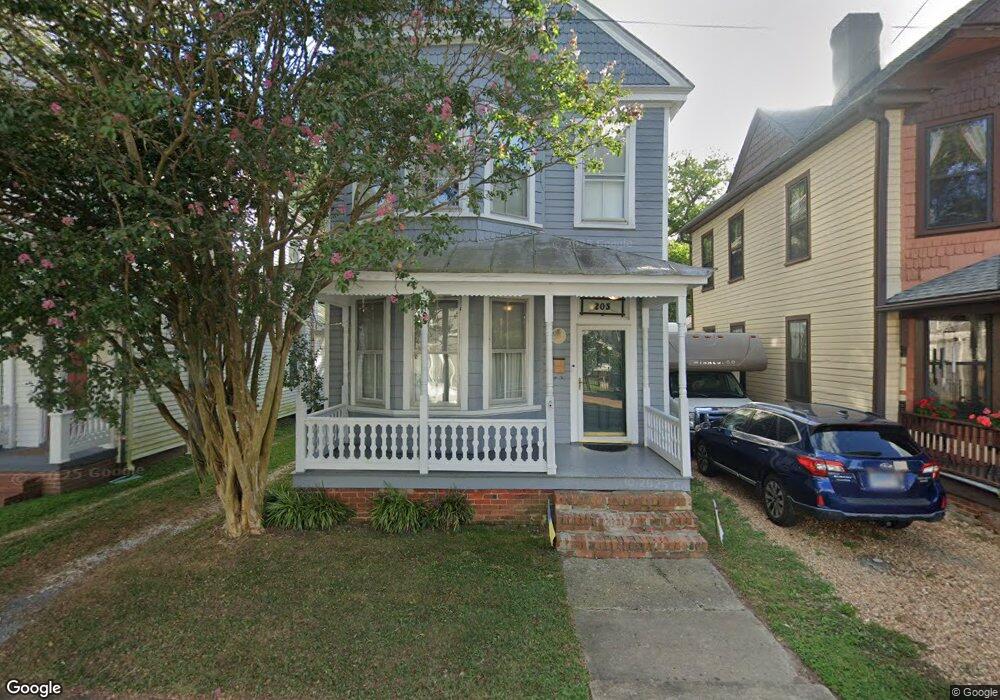
203 N Mason St Smithfield, VA 23430
Estimated Value: $348,000 - $487,000
3
Beds
2
Baths
1,892
Sq Ft
$211/Sq Ft
Est. Value
About This Home
This home is located at 203 N Mason St, Smithfield, VA 23430 and is currently estimated at $399,131, approximately $210 per square foot. 203 N Mason St is a home located in Isle of Wight County with nearby schools including Hardy Elementary School, Smithfield Middle School, and Smithfield High School.
Ownership History
Date
Name
Owned For
Owner Type
Purchase Details
Closed on
May 11, 2023
Sold by
Wise Guys Llc
Bought by
Montague Elizabeth and Stafford Sascha
Current Estimated Value
Home Financials for this Owner
Home Financials are based on the most recent Mortgage that was taken out on this home.
Original Mortgage
$280,800
Outstanding Balance
$272,834
Interest Rate
6.28%
Mortgage Type
New Conventional
Estimated Equity
$126,297
Purchase Details
Closed on
Dec 14, 2021
Sold by
Tucker Jonathan P
Bought by
Wise Guys Llc
Purchase Details
Closed on
Aug 31, 2007
Sold by
Schweitzer Elaine T Trustee
Purchase Details
Closed on
Aug 12, 1998
Create a Home Valuation Report for This Property
The Home Valuation Report is an in-depth analysis detailing your home's value as well as a comparison with similar homes in the area
Home Values in the Area
Average Home Value in this Area
Purchase History
| Date | Buyer | Sale Price | Title Company |
|---|---|---|---|
| Montague Elizabeth | $365,000 | Fidelity National Title Insura | |
| Wise Guys Llc | $185,000 | Virginia Home Title | |
| -- | $255,000 | -- | |
| -- | $59,000 | -- |
Source: Public Records
Mortgage History
| Date | Status | Borrower | Loan Amount |
|---|---|---|---|
| Open | Montague Elizabeth | $280,800 |
Source: Public Records
Tax History Compared to Growth
Tax History
| Year | Tax Paid | Tax Assessment Tax Assessment Total Assessment is a certain percentage of the fair market value that is determined by local assessors to be the total taxable value of land and additions on the property. | Land | Improvement |
|---|---|---|---|---|
| 2024 | $1,820 | $249,300 | $45,000 | $204,300 |
| 2023 | $1,824 | $249,300 | $45,000 | $204,300 |
| 2022 | $1,666 | $189,600 | $45,000 | $144,600 |
| 2021 | $1,666 | $189,600 | $45,000 | $144,600 |
| 2020 | $1,666 | $189,600 | $45,000 | $144,600 |
| 2019 | $1,666 | $189,600 | $45,000 | $144,600 |
| 2018 | $1,615 | $183,700 | $45,000 | $138,700 |
| 2016 | $1,633 | $183,700 | $45,000 | $138,700 |
| 2015 | $1,592 | $183,700 | $45,000 | $138,700 |
| 2014 | $1,592 | $178,800 | $45,000 | $133,800 |
| 2013 | -- | $178,800 | $45,000 | $133,800 |
Source: Public Records
Map
Nearby Homes