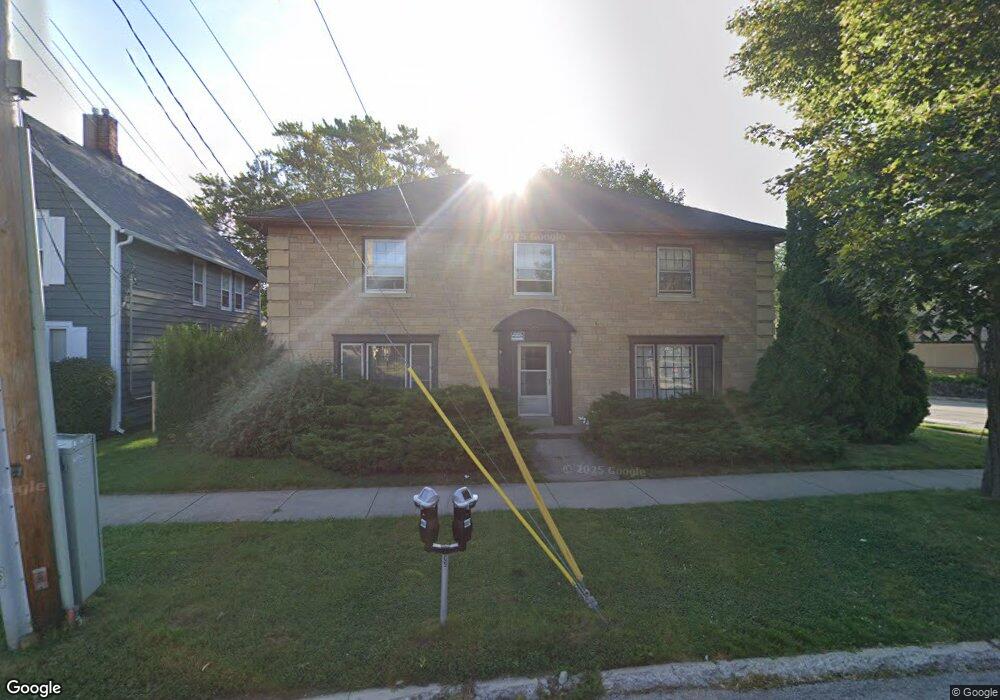
203 N Ml King jr Ave Waukegan, IL 60085
Downtown Waukegan NeighborhoodEstimated Value: $283,000 - $340,000
4
Beds
4
Baths
2,944
Sq Ft
$109/Sq Ft
Est. Value
About This Home
This home is located at 203 N Ml King jr Ave, Waukegan, IL 60085 and is currently estimated at $321,685, approximately $109 per square foot. 203 N Ml King jr Ave is a home located in Lake County with nearby schools including Miguel Juarez Middle School, Waukegan High School, and Most Blessed Trinity Academy.
Ownership History
Date
Name
Owned For
Owner Type
Purchase Details
Closed on
Jun 1, 2006
Sold by
Petre Magdalena
Bought by
Petre Teodor G and Petre Magdalena
Current Estimated Value
Purchase Details
Closed on
Jan 5, 2005
Sold by
Buege Robert M
Bought by
Petre Magdalena
Home Financials for this Owner
Home Financials are based on the most recent Mortgage that was taken out on this home.
Original Mortgage
$198,000
Outstanding Balance
$116,955
Interest Rate
8.42%
Mortgage Type
Commercial
Estimated Equity
$204,730
Purchase Details
Closed on
Jul 12, 1994
Sold by
Mckeown Denis J and Mckeown Margaret S
Bought by
Buege Robert M
Home Financials for this Owner
Home Financials are based on the most recent Mortgage that was taken out on this home.
Original Mortgage
$170,000
Interest Rate
8.6%
Mortgage Type
Commercial
Create a Home Valuation Report for This Property
The Home Valuation Report is an in-depth analysis detailing your home's value as well as a comparison with similar homes in the area
Home Values in the Area
Average Home Value in this Area
Purchase History
| Date | Buyer | Sale Price | Title Company |
|---|---|---|---|
| Petre Teodor G | -- | None Available | |
| Petre Magdalena | $220,000 | First American Title Ins Co | |
| Buege Robert M | $156,500 | Chicago Title Insurance Co |
Source: Public Records
Mortgage History
| Date | Status | Borrower | Loan Amount |
|---|---|---|---|
| Open | Petre Magdalena | $198,000 | |
| Previous Owner | Buege Robert M | $170,000 |
Source: Public Records
Tax History Compared to Growth
Tax History
| Year | Tax Paid | Tax Assessment Tax Assessment Total Assessment is a certain percentage of the fair market value that is determined by local assessors to be the total taxable value of land and additions on the property. | Land | Improvement |
|---|---|---|---|---|
| 2024 | $5,443 | $66,102 | $6,921 | $59,181 |
| 2023 | $6,300 | $57,718 | $5,680 | $52,038 |
| 2022 | $6,300 | $64,447 | $5,690 | $58,757 |
| 2021 | $5,743 | $55,088 | $4,884 | $50,204 |
| 2020 | $5,818 | $51,321 | $4,550 | $46,771 |
| 2019 | $5,855 | $47,027 | $4,169 | $42,858 |
| 2018 | $5,254 | $40,639 | $6,135 | $34,504 |
| 2017 | $5,114 | $35,954 | $5,428 | $30,526 |
| 2016 | $4,828 | $31,243 | $4,717 | $26,526 |
| 2015 | $4,724 | $27,963 | $4,222 | $23,741 |
| 2014 | $5,392 | $31,870 | $5,004 | $26,866 |
| 2012 | $6,682 | $34,528 | $5,422 | $29,106 |
Source: Public Records
Map
Nearby Homes
- 222 Grand Ave
- 452 North Ave
- 28 N Saint James St
- 613 Washington St
- 557 W Water St
- 428 N Poplar St
- 611 N Genesee St
- 511 Chestnut St
- 325 4th St
- 522 N Poplar St
- 610 Bluff St
- 702 Franklin St
- 215 S Park Ave
- 620 N Poplar St
- 723 N County St
- 23 N Jackson St
- 502 Belvidere Rd
- 613 Clarke Ave
- 304 Powell Ave
- 305 Besley Place
- 207 N Martin Luther King jr Ave
- 200 N County St
- 200 N County St Unit 204
- 210 N Martin Luther King jr Ave
- 212 N County St
- 202 N County St Unit 205
- 202 N County St Unit P4
- 202 N County St Unit 202
- 412 W Clayton St
- 222 N Martin Luther King jr Ave
- 218 N County St
- 414 W Clayton St
- 418 W Clayton St
- 228 N Martin Luther King jr Ave
- 228 N Ml King jr Ave
- 409 Grand Ave
- 415 Grand Ave
- 227 N West St
- 419 Grand Ave
- 202 N Genesee St