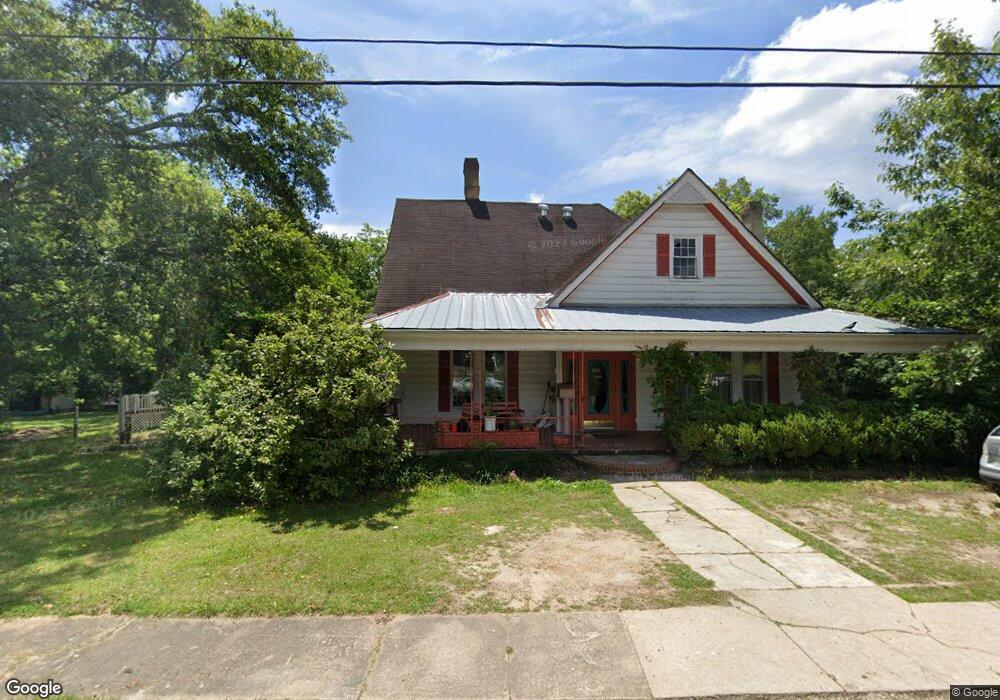
203 N Rhodes St Union Point, GA 30669
Estimated Value: $267,000 - $409,000
5
Beds
3
Baths
3,668
Sq Ft
$94/Sq Ft
Est. Value
About This Home
This home is located at 203 N Rhodes St, Union Point, GA 30669 and is currently estimated at $346,087, approximately $94 per square foot. 203 N Rhodes St is a home located in Greene County with nearby schools including Greene County High School.
Ownership History
Date
Name
Owned For
Owner Type
Purchase Details
Closed on
Aug 30, 2013
Sold by
Lord Paula Jane
Bought by
Lord David W and Lord Frances J
Current Estimated Value
Purchase Details
Closed on
Apr 10, 2013
Sold by
Lord David Wayne
Bought by
Lord Paula Jane and Gresham Connie Iyrae
Purchase Details
Closed on
Oct 12, 1995
Sold by
Lord Frances
Bought by
Lord David W
Purchase Details
Closed on
Jan 1, 1985
Sold by
Lord Frances
Bought by
Lord Frances
Purchase Details
Closed on
Jan 1, 1982
Sold by
Veazy Anita
Bought by
Lord Frances
Purchase Details
Closed on
Jan 1, 1976
Sold by
Lord David W
Bought by
Veazy Anita
Purchase Details
Closed on
Jan 1, 1972
Sold by
Fidelity & Casualty
Bought by
Lord David W
Purchase Details
Closed on
Jan 1, 1971
Sold by
Eash Leta V
Bought by
Fidelity & Casualty
Purchase Details
Closed on
Jan 1, 1956
Bought by
Eash Leta V
Create a Home Valuation Report for This Property
The Home Valuation Report is an in-depth analysis detailing your home's value as well as a comparison with similar homes in the area
Home Values in the Area
Average Home Value in this Area
Purchase History
| Date | Buyer | Sale Price | Title Company |
|---|---|---|---|
| Lord David W | -- | -- | |
| Lord Paula Jane | -- | -- | |
| Lord David W | -- | -- | |
| Lord Frances | -- | -- | |
| Lord Frances | -- | -- | |
| Veazy Anita | -- | -- | |
| Lord David W | -- | -- | |
| Fidelity & Casualty | -- | -- | |
| Eash Leta V | -- | -- |
Source: Public Records
Tax History Compared to Growth
Tax History
| Year | Tax Paid | Tax Assessment Tax Assessment Total Assessment is a certain percentage of the fair market value that is determined by local assessors to be the total taxable value of land and additions on the property. | Land | Improvement |
|---|---|---|---|---|
| 2024 | $1,596 | $135,400 | $7,520 | $127,880 |
| 2023 | $423 | $131,440 | $7,520 | $123,920 |
| 2022 | $670 | $120,200 | $7,520 | $112,680 |
| 2021 | $692 | $109,080 | $7,520 | $101,560 |
| 2020 | $518 | $33,840 | $4,040 | $29,800 |
| 2019 | $535 | $33,840 | $4,040 | $29,800 |
| 2018 | $397 | $33,840 | $4,040 | $29,800 |
| 2017 | $475 | $33,498 | $4,050 | $29,448 |
| 2016 | $520 | $35,342 | $4,050 | $31,292 |
| 2015 | $383 | $35,342 | $4,050 | $31,292 |
| 2014 | $529 | $37,101 | $4,050 | $33,051 |
Source: Public Records
Map
Nearby Homes
- 215 Hunter St
- 324 N Rhodes St
- 606 Bryan Ave
- 202 Veazey St
- 0 S Rhodes St Unit 10618488
- 504 Crawfordville Rd
- 0 Woodland Ct Unit 1027434
- 0 Woodland Ct Unit 10543600
- 1010 Orear Rd
- 0 Washington Hwy Unit 7276060
- 1180 Moody St
- 1041 Hillcrest Dr
- 1241 Old Siloam Rd
- 1860 Washington Hwy
- 0 Buffalo Lick Rd Unit 10551328
- 1201 Buffalo Lick Rd
- 0 Buffalo Lick Rd Unit 10551325
- 0 Buffalo Lick Rd Unit 10551234
- 1251 Adams Rd
- 0 Old Union Point Rd Unit 1 10557753
- 205 N Rhodes St
- 207 N Rhodes St
- 206 N Rhodes St
- 105 N Rhodes St
- 209 N Rhodes St
- 0 Stewart Ave Unit 8350399
- 0 Stewart Ave Unit 8354364
- 0 Stewart Ave Unit 8260371
- 0 Stewart Ave Unit 8112724
- 0 Stewart Ave Unit 8068116
- 0 Stewart Ave Unit 7449797
- 0 Stewart Ave Unit 8802982
- 0 Stewart Ave
- 204 N Rhodes St
- 704 Hart Ave
- 5 N Rhodes St
- 101 N Rhodes St
- 110 N Rhodes St
- 803 Dolvin Ave
- 702 Hart Ave