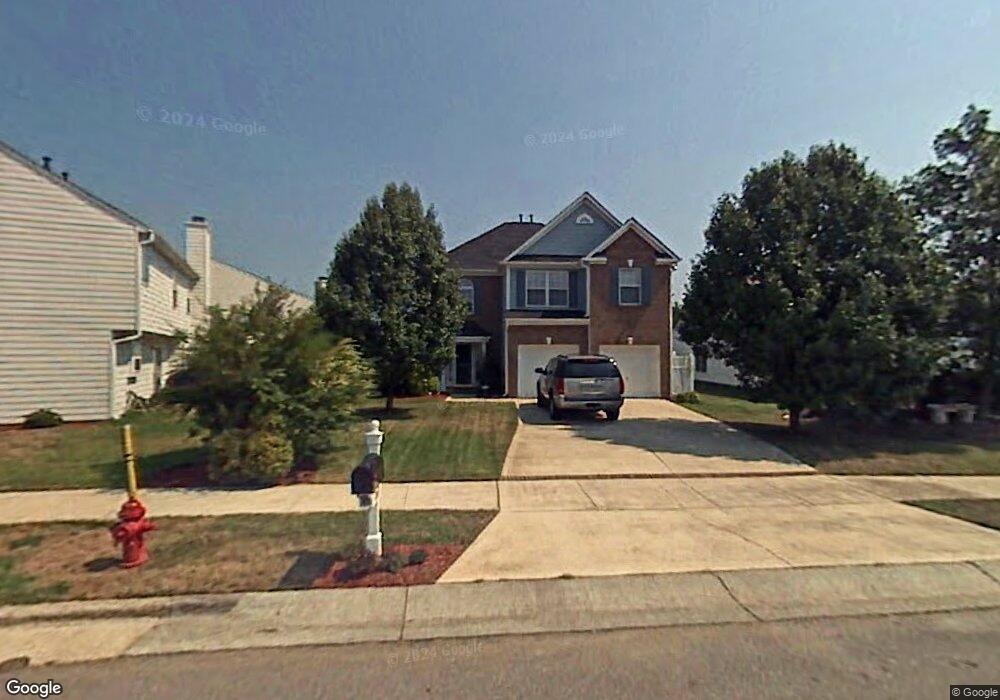
203 Newberry Ln Durham, NC 27703
Eastern Durham NeighborhoodEstimated Value: $413,088 - $448,000
4
Beds
3
Baths
2,302
Sq Ft
$185/Sq Ft
Est. Value
About This Home
This home is located at 203 Newberry Ln, Durham, NC 27703 and is currently estimated at $426,522, approximately $185 per square foot. 203 Newberry Ln is a home located in Durham County with nearby schools including Oak Grove Elementary, John W Neal Middle School, and Southern School of Energy & Sustainability.
Ownership History
Date
Name
Owned For
Owner Type
Purchase Details
Closed on
Jun 22, 2014
Sold by
Wisniewski Brad M and Ortiz Jacqueline
Bought by
Covington James E and Bailey Jessica N
Current Estimated Value
Home Financials for this Owner
Home Financials are based on the most recent Mortgage that was taken out on this home.
Original Mortgage
$181,649
Outstanding Balance
$138,322
Interest Rate
4.23%
Mortgage Type
FHA
Estimated Equity
$288,200
Purchase Details
Closed on
Dec 28, 2007
Sold by
Byrnes Thomas P and Byrnes Diane L
Bought by
Wisniewski Brad M and Ortiz Jacqueline
Home Financials for this Owner
Home Financials are based on the most recent Mortgage that was taken out on this home.
Original Mortgage
$185,250
Interest Rate
6.21%
Mortgage Type
Purchase Money Mortgage
Purchase Details
Closed on
Jun 29, 2000
Sold by
D R Horton Inc Torrey
Bought by
Byrnes Thomas P and Byrnes Diane L
Home Financials for this Owner
Home Financials are based on the most recent Mortgage that was taken out on this home.
Original Mortgage
$140,000
Interest Rate
8.63%
Create a Home Valuation Report for This Property
The Home Valuation Report is an in-depth analysis detailing your home's value as well as a comparison with similar homes in the area
Home Values in the Area
Average Home Value in this Area
Purchase History
| Date | Buyer | Sale Price | Title Company |
|---|---|---|---|
| Covington James E | $185,000 | None Available | |
| Wisniewski Brad M | $195,000 | None Available | |
| Byrnes Thomas P | $176,000 | -- |
Source: Public Records
Mortgage History
| Date | Status | Borrower | Loan Amount |
|---|---|---|---|
| Open | Covington James E | $181,649 | |
| Previous Owner | Wisniewski Brad M | $185,250 | |
| Previous Owner | Byrnes Thomas P | $140,000 |
Source: Public Records
Tax History Compared to Growth
Tax History
| Year | Tax Paid | Tax Assessment Tax Assessment Total Assessment is a certain percentage of the fair market value that is determined by local assessors to be the total taxable value of land and additions on the property. | Land | Improvement |
|---|---|---|---|---|
| 2025 | $4,001 | $403,589 | $88,500 | $315,089 |
| 2024 | $3,119 | $223,608 | $44,362 | $179,246 |
| 2023 | $2,929 | $223,608 | $44,362 | $179,246 |
| 2022 | $2,862 | $223,608 | $44,362 | $179,246 |
| 2021 | $2,849 | $223,608 | $44,362 | $179,246 |
| 2020 | $2,781 | $223,608 | $44,362 | $179,246 |
| 2019 | $2,781 | $223,608 | $44,362 | $179,246 |
| 2018 | $2,666 | $196,539 | $41,370 | $155,169 |
| 2017 | $2,646 | $196,539 | $41,370 | $155,169 |
| 2016 | $2,557 | $196,539 | $41,370 | $155,169 |
| 2015 | $2,809 | $202,917 | $35,571 | $167,346 |
| 2014 | $2,809 | $202,917 | $35,571 | $167,346 |
Source: Public Records
Map
Nearby Homes
- 106 Newberry Ln
- 110 Kindlewood Dr
- 10 Autrey Mill Cir
- 103 Bermuda Green Dr
- 2117 Fletchers Ridge Dr
- 208 Lick Creek Ln
- 301 Sylvias Ct
- 1 Thorn Brook Ct
- 1 Kings Grant Ct
- 416 Chivalry Dr
- 406 Robbins Rd
- 402 Robbins Rd
- 5409 Hadrian Dr
- 2800-2809 Napoli Dr
- 4 Fire Rock Place
- 612 Chivalry Dr
- 5609 Thistlerock Ln
- 503 Bellmeade Bay Dr
- 59 Enesco Cir
- 31 S Angela Cir
- 205 Newberry Ln
- 2 Bermuda Ct
- 4 Bermuda Ct
- 207 Newberry Ln
- EV102 Newberry Ln
- EV71 Newberry Ln
- EV109 Newberry Ln
- EV84 Newberry Ln
- EV85 Newberry Ln
- 6 Bermuda Ct
- EV103 Bermuda Ct
- EV104 Bermuda Ct
- EV106 Bermuda Ct
- EV105 Bermuda Ct
- 199 Bermuda Ct
- 204 Bermuda Ct
- 211 Newberry Ln
- 202 Newberry Ln
- 204 Newberry Ln
- 7 Bermuda Ct