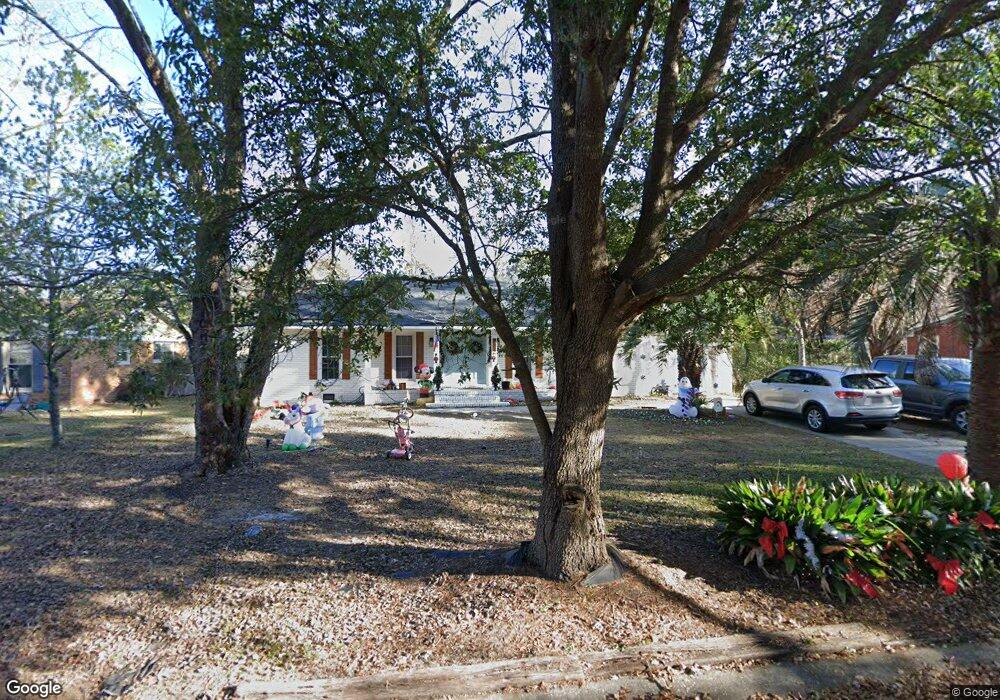
203 Niblick Rd Unit 1 Summerville, SC 29483
Estimated Value: $335,000 - $369,000
3
Beds
2
Baths
1,400
Sq Ft
$249/Sq Ft
Est. Value
About This Home
This home is located at 203 Niblick Rd Unit 1, Summerville, SC 29483 and is currently estimated at $349,081, approximately $249 per square foot. 203 Niblick Rd Unit 1 is a home located in Dorchester County with nearby schools including Newington Elementary School, Charles B. DuBose Middle School, and Summerville High School.
Ownership History
Date
Name
Owned For
Owner Type
Purchase Details
Closed on
Feb 27, 2023
Sold by
Mvp Homes Inc
Bought by
Powell Jonathan and Powell Amanda
Current Estimated Value
Home Financials for this Owner
Home Financials are based on the most recent Mortgage that was taken out on this home.
Original Mortgage
$373,996
Outstanding Balance
$362,297
Interest Rate
6.15%
Mortgage Type
VA
Estimated Equity
-$13,216
Purchase Details
Closed on
Jan 12, 2022
Sold by
Eugen Kiefel
Bought by
Mvp Homes Inc
Purchase Details
Closed on
Jul 5, 2017
Sold by
Skipper Christopher Mark
Bought by
Kiefel Eugen
Purchase Details
Closed on
Jan 28, 2013
Sold by
Estate Of Patricia M Skipper and Skipper Christopher Mark
Bought by
Not Provided
Purchase Details
Closed on
Mar 21, 2001
Sold by
Corey Woods Llc
Bought by
Skipper Patricia
Create a Home Valuation Report for This Property
The Home Valuation Report is an in-depth analysis detailing your home's value as well as a comparison with similar homes in the area
Home Values in the Area
Average Home Value in this Area
Purchase History
| Date | Buyer | Sale Price | Title Company |
|---|---|---|---|
| Powell Jonathan | $361,000 | -- | |
| Mvp Homes Inc | $200,000 | Cobb Dill & Hammett Llc | |
| Kiefel Eugen | $135,000 | None Available | |
| Not Provided | -- | -- | |
| Skipper Patricia | $73,500 | -- |
Source: Public Records
Mortgage History
| Date | Status | Borrower | Loan Amount |
|---|---|---|---|
| Open | Powell Jonathan | $373,996 |
Source: Public Records
Tax History Compared to Growth
Tax History
| Year | Tax Paid | Tax Assessment Tax Assessment Total Assessment is a certain percentage of the fair market value that is determined by local assessors to be the total taxable value of land and additions on the property. | Land | Improvement |
|---|---|---|---|---|
| 2024 | $3,374 | $14,338 | $3,200 | $11,138 |
| 2023 | $3,374 | $11,807 | $4,800 | $7,007 |
| 2022 | $3,962 | $9,320 | $2,420 | $6,900 |
| 2021 | $4,047 | $9,320 | $2,420 | $6,900 |
| 2020 | $3,893 | $4,970 | $1,400 | $3,570 |
| 2019 | $3,957 | $4,970 | $1,400 | $3,570 |
| 2018 | $3,298 | $4,970 | $1,400 | $3,570 |
| 2017 | $1,173 | $4,970 | $1,400 | $3,570 |
| 2016 | $1,154 | $4,970 | $1,400 | $3,570 |
| 2015 | $1,156 | $4,970 | $1,400 | $3,570 |
| 2014 | $642 | $109,600 | $0 | $0 |
| 2013 | -- | $4,380 | $0 | $0 |
Source: Public Records
Map
Nearby Homes
- 111 Driver Ave
- 301 Corey Blvd
- 118 Driver Ave
- 124 Helen Dr
- 114 Reynolds Rd
- 122 Five Iron Cir
- 108 Helen Dr
- 103 Four Iron Dr
- 121 Mary Ann Dr
- 96 Four Iron Ct
- 618 Boone Hill Rd
- 115 Loblolly Ln
- 00 Wilson Dr
- 901 Simmons Ave
- 114 Ford Ct
- 125 White Blvd
- 112 Pamela Ln
- 403 Logan Dr
- 444 Longleaf Dr
- 220 O'Leary Cir
- 203 Niblick Rd
- 205 Niblick Rd
- 500 Corey Blvd
- 106 Sandtrap Rd
- 104 Sandtrap Rd
- 502 Corey Blvd
- 207 Niblick Rd
- 418 Corey Blvd
- 102 Sandtrap Rd
- 108 Sandtrap Rd
- 202 Niblick Rd
- 209 Niblick Rd
- 504 Corey Blvd
- 103 Clubhouse Rd
- 415 Corey Blvd
- 501 Corey Blvd
- 416 Corey Blvd
- 105 Sandtrap Rd
- 110 Sandtrap Rd
- 206 Niblick Rd