Estimated Value: $571,815 - $624,000
--
Bed
--
Bath
1,366
Sq Ft
$440/Sq Ft
Est. Value
About This Home
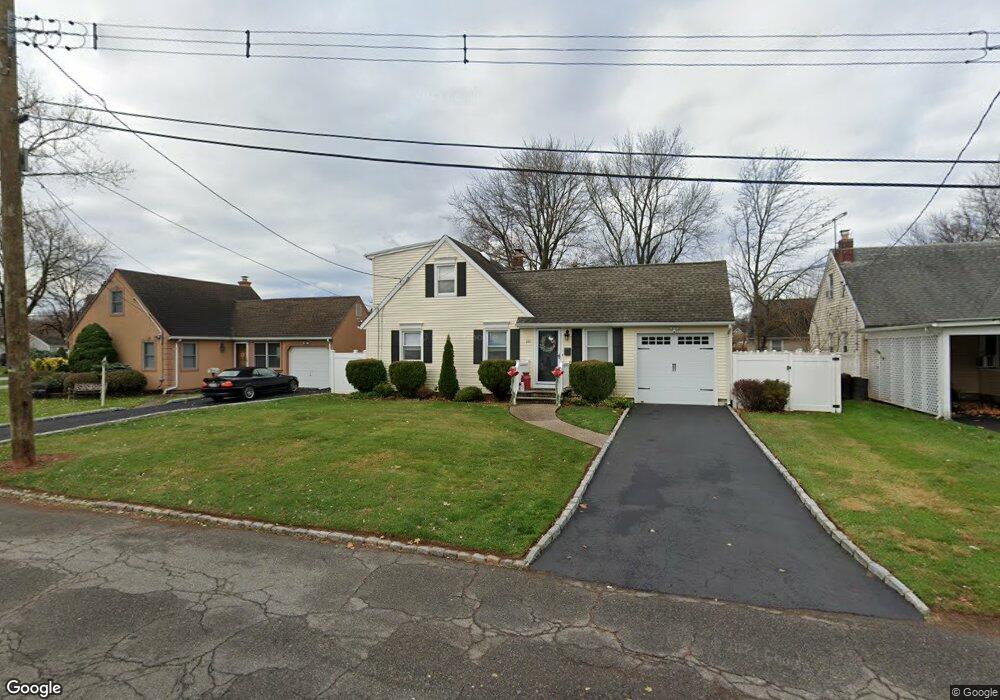
This home is located at 203 North Ln, Clark, NJ 07066 and is currently estimated at $600,704, approximately $439 per square foot. 203 North Ln is a home located in Union County with nearby schools including Valley Road Elementary School, Carl H. Kumpf Middle School, and Arthur L. Johnson High School.
Ownership History
Date
Name
Owned For
Owner Type
Purchase Details
Closed on
May 7, 2001
Sold by
Dwyer Donn J and Dwyer Karen M Scaduto
Bought by
Agresta Maria D
Current Estimated Value
Home Financials for this Owner
Home Financials are based on the most recent Mortgage that was taken out on this home.
Original Mortgage
$50,000
Outstanding Balance
$18,698
Interest Rate
7.05%
Estimated Equity
$582,006
Purchase Details
Closed on
Aug 31, 1999
Sold by
Dwyer Donn J
Bought by
Dwyer Donn J and Scaduto Dwyer Karen M
Create a Home Valuation Report for This Property
The Home Valuation Report is an in-depth analysis detailing your home's value as well as a comparison with similar homes in the area
Home Values in the Area
Average Home Value in this Area
Purchase History
| Date | Buyer | Sale Price | Title Company |
|---|---|---|---|
| Agresta Maria D | $186,000 | -- | |
| Dwyer Donn J | -- | -- |
Source: Public Records
Mortgage History
| Date | Status | Borrower | Loan Amount |
|---|---|---|---|
| Open | Agresta Maria D | $50,000 |
Source: Public Records
Tax History Compared to Growth
Tax History
| Year | Tax Paid | Tax Assessment Tax Assessment Total Assessment is a certain percentage of the fair market value that is determined by local assessors to be the total taxable value of land and additions on the property. | Land | Improvement |
|---|---|---|---|---|
| 2025 | $9,046 | $408,600 | $244,400 | $164,200 |
| 2024 | $8,912 | $408,600 | $244,400 | $164,200 |
| 2023 | $8,912 | $408,600 | $244,400 | $164,200 |
| 2022 | $8,654 | $408,600 | $244,400 | $164,200 |
| 2021 | $7,228 | $81,300 | $41,000 | $40,300 |
| 2020 | $7,110 | $81,300 | $41,000 | $40,300 |
| 2019 | $7,038 | $81,300 | $41,000 | $40,300 |
| 2018 | $6,954 | $81,300 | $41,000 | $40,300 |
| 2017 | $6,842 | $81,300 | $41,000 | $40,300 |
| 2016 | $6,590 | $81,300 | $41,000 | $40,300 |
| 2015 | $6,524 | $81,300 | $41,000 | $40,300 |
| 2014 | $6,386 | $81,300 | $41,000 | $40,300 |
Source: Public Records
Map
Nearby Homes
- 275 Valley Rd
- 331 West Ln
- 5 Sycamore Rd
- 2 Autumn Ave
- 52 Skylark Place
- 65 Colonial Dr
- 1 Crestwood Ln
- 565 Valley Rd
- 783 Riverbend Dr
- 27 Grand St
- 1717 Crescent Pkwy
- 157 Westfield Ave
- 25 Poplar Terrace
- 22 Washington St
- 2316 Old Grove Rd
- 12 Bartell Place
- 22 Sunset Dr
- 910 Apgar Terrace
- 1374 Lambert St
- 1915 Crescent Pkwy