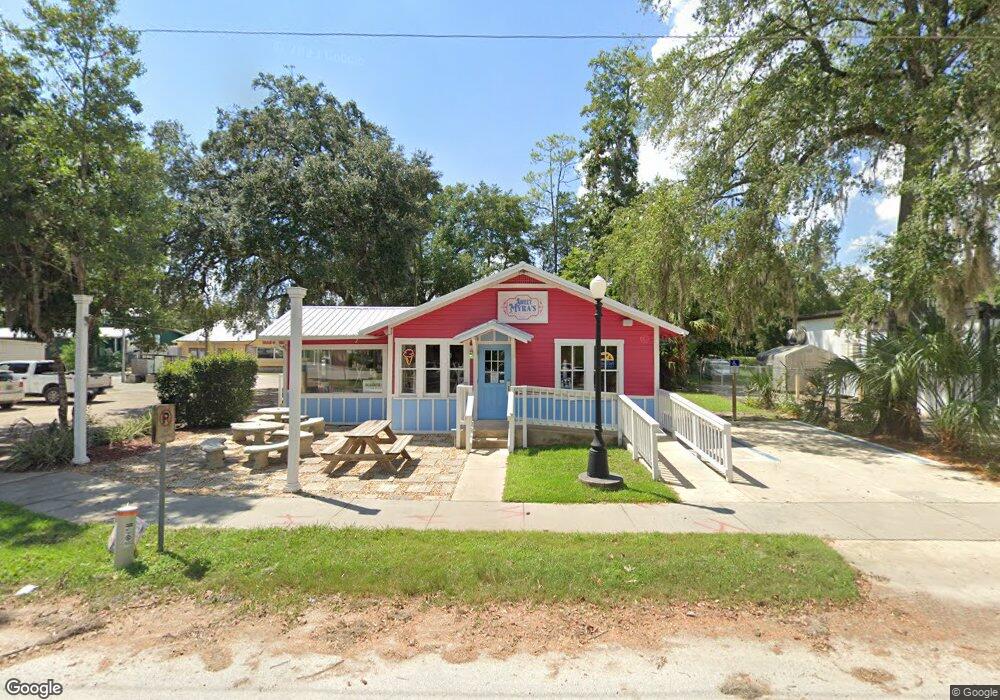
203 NW 1st St Trenton, FL 32693
Estimated Value: $227,124
--
Bed
--
Bath
1,728
Sq Ft
$131/Sq Ft
Est. Value
About This Home
This home is located at 203 NW 1st St, Trenton, FL 32693 and is currently estimated at $227,124, approximately $131 per square foot. 203 NW 1st St is a home located in Gilchrist County with nearby schools including First Place Academy.
Ownership History
Date
Name
Owned For
Owner Type
Purchase Details
Closed on
Jul 29, 2025
Sold by
Gavitt Glenn and Gavitt Rebecca
Bought by
Sand Dollar Harbor Llc
Current Estimated Value
Purchase Details
Closed on
Jan 2, 2018
Sold by
Aline Smith
Bought by
Gavitt Glenn and Gavitt Rebecca
Home Financials for this Owner
Home Financials are based on the most recent Mortgage that was taken out on this home.
Original Mortgage
$109,370
Interest Rate
3.95%
Mortgage Type
New Conventional
Purchase Details
Closed on
Dec 8, 2017
Sold by
Aline Smith
Bought by
Gavitt Glenn and Gavitt Rebecca
Home Financials for this Owner
Home Financials are based on the most recent Mortgage that was taken out on this home.
Original Mortgage
$109,370
Interest Rate
3.95%
Mortgage Type
New Conventional
Purchase Details
Closed on
Jul 23, 2010
Sold by
Ridgeway Jerry H and Ridgeway Jean L
Bought by
Smith Aline M and Farnbach Grady Lee
Create a Home Valuation Report for This Property
The Home Valuation Report is an in-depth analysis detailing your home's value as well as a comparison with similar homes in the area
Home Values in the Area
Average Home Value in this Area
Purchase History
| Date | Buyer | Sale Price | Title Company |
|---|---|---|---|
| Sand Dollar Harbor Llc | $100 | None Listed On Document | |
| Gavitt Glenn | $130,000 | New Title Company Name | |
| Gavitt Glenn | $130,000 | New Title Company Name | |
| Smith Aline M | $190,000 | Attorney |
Source: Public Records
Mortgage History
| Date | Status | Borrower | Loan Amount |
|---|---|---|---|
| Previous Owner | Gavitt Glenn | $109,370 | |
| Previous Owner | Gavitt Glenn | $109,370 |
Source: Public Records
Tax History Compared to Growth
Tax History
| Year | Tax Paid | Tax Assessment Tax Assessment Total Assessment is a certain percentage of the fair market value that is determined by local assessors to be the total taxable value of land and additions on the property. | Land | Improvement |
|---|---|---|---|---|
| 2024 | $2,000 | $100,212 | $13,475 | $86,737 |
| 2023 | $2,000 | $100,224 | $12,100 | $88,124 |
| 2022 | $1,980 | $99,929 | $11,000 | $88,929 |
| 2021 | $1,667 | $79,135 | $8,800 | $70,335 |
| 2020 | $1,561 | $73,035 | $10,050 | $62,985 |
| 2019 | $1,563 | $72,335 | $10,050 | $62,285 |
| 2018 | $1,602 | $73,538 | $10,050 | $63,488 |
| 2017 | $1,992 | $93,676 | $0 | $0 |
| 2016 | $2,058 | $95,255 | $0 | $0 |
| 2015 | $2,154 | $98,133 | $0 | $0 |
| 2013 | -- | $101,317 | $0 | $0 |
Source: Public Records
Map
Nearby Homes
- 511 NW 2nd St
- 501 NW 2nd St
- 5290 SE 1st St
- 311 SW 4th St
- 418 SW 5th Ave
- 730 SW Second Ave
- 872 SW Second Ave
- 915 SW 4th Ave
- 413 NE 7th St
- 823 E Wade St
- 173 SW 24th Ave
- 1119 SW 4th Ave
- LOT 3 Florida 26
- LOT 4 Florida 26
- Lot A 00 Cr 344
- 1233 SW 4th Ave
- 000 E Wade St
- 901 NE 11th Ave
- 917 NE 11th Ave
- 930 NE 14th Ave