Estimated Value: $176,000 - $194,000
3
Beds
2
Baths
1,218
Sq Ft
$150/Sq Ft
Est. Value
About This Home
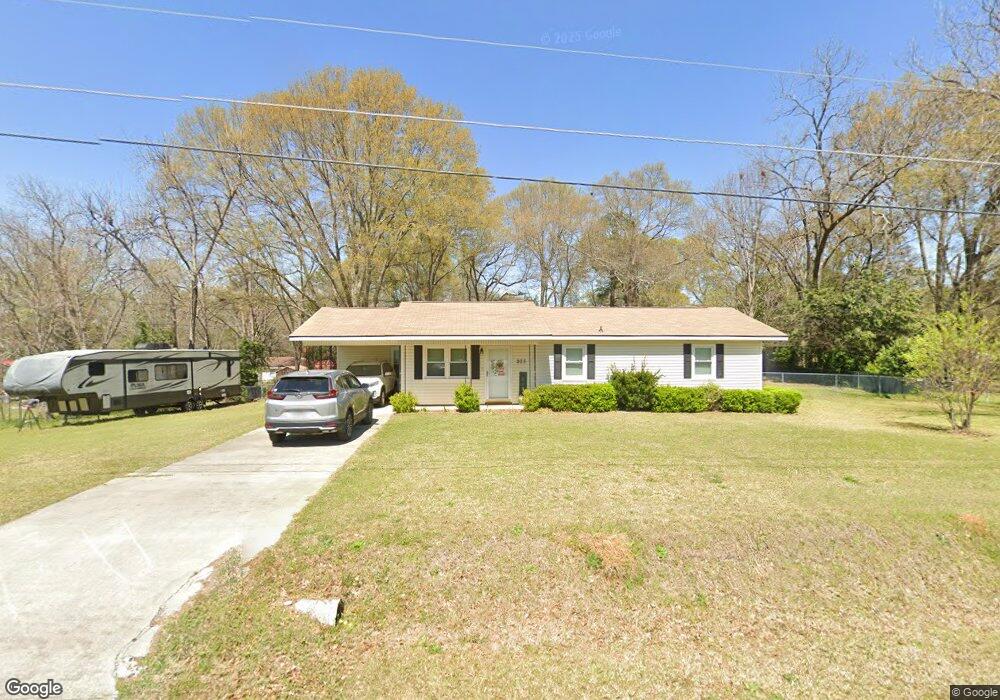
This home is located at 203 Oak Ridge Dr, Byron, GA 31008 and is currently estimated at $182,992, approximately $150 per square foot. 203 Oak Ridge Dr is a home located in Peach County with nearby schools including Kay Road Elementary School, Fort Valley Middle School, and Peach County High School.
Ownership History
Date
Name
Owned For
Owner Type
Purchase Details
Closed on
Mar 6, 2024
Sold by
Krupke Jeffrey J
Bought by
Drupke Trust and Krupke Tracy A Tr
Current Estimated Value
Purchase Details
Closed on
Oct 26, 2020
Sold by
Flanders Jackie Wayne
Bought by
Krupke Jeffrey J
Home Financials for this Owner
Home Financials are based on the most recent Mortgage that was taken out on this home.
Original Mortgage
$120,968
Interest Rate
2.9%
Mortgage Type
FHA
Purchase Details
Closed on
Aug 7, 2020
Sold by
Lee Louise
Bought by
Flanders Jackie Wayne and Flanders Robert Michael
Purchase Details
Closed on
Aug 8, 2007
Sold by
Burke Danny D
Bought by
Lee Louise L
Purchase Details
Closed on
Jun 10, 1996
Bought by
Burke Danny D
Purchase Details
Closed on
Feb 1, 1991
Bought by
Davis Robert K and Davis Sandra D
Purchase Details
Closed on
Jan 5, 1989
Bought by
Mckinney Hugh E
Create a Home Valuation Report for This Property
The Home Valuation Report is an in-depth analysis detailing your home's value as well as a comparison with similar homes in the area
Home Values in the Area
Average Home Value in this Area
Purchase History
| Date | Buyer | Sale Price | Title Company |
|---|---|---|---|
| Drupke Trust | -- | -- | |
| Krupke Jeffrey J | $123,200 | -- | |
| Flanders Jackie Wayne | -- | -- | |
| Lee Louise L | $95,500 | -- | |
| Burke Danny D | $60,000 | -- | |
| Davis Robert K | $46,000 | -- | |
| Mckinney Hugh E | $42,500 | -- |
Source: Public Records
Mortgage History
| Date | Status | Borrower | Loan Amount |
|---|---|---|---|
| Previous Owner | Krupke Jeffrey J | $120,968 |
Source: Public Records
Tax History Compared to Growth
Tax History
| Year | Tax Paid | Tax Assessment Tax Assessment Total Assessment is a certain percentage of the fair market value that is determined by local assessors to be the total taxable value of land and additions on the property. | Land | Improvement |
|---|---|---|---|---|
| 2024 | $1,964 | $56,520 | $5,400 | $51,120 |
| 2023 | $1,943 | $55,600 | $4,320 | $51,280 |
| 2022 | $1,260 | $48,800 | $4,320 | $44,480 |
| 2021 | $1,226 | $41,280 | $4,320 | $36,960 |
| 2020 | $421 | $31,480 | $4,320 | $27,160 |
| 2019 | $423 | $31,480 | $4,320 | $27,160 |
| 2018 | $425 | $31,480 | $4,320 | $27,160 |
| 2017 | $427 | $31,480 | $4,320 | $27,160 |
| 2016 | $425 | $31,480 | $4,320 | $27,160 |
| 2015 | -- | $31,480 | $4,320 | $27,160 |
| 2014 | $425 | $31,480 | $4,320 | $27,160 |
| 2013 | -- | $31,480 | $4,320 | $27,160 |
Source: Public Records
Map
Nearby Homes
- 113 Sweetspire Ln
- 104 Chickasaw Ct
- 109 Abelia Ln
- 112 Abelia Ln
- 135 Abelia Ln
- 476 Walker Rd
- 00 Georgia 49
- 250 Shantz Way
- 250 Shantz Way Unit LOT A42
- 212 Eric Ct
- 262 Shantz Way
- 206 Eric Ct
- 256 Shantz Way Unit (LOT A45)
- 202 Eric Ct
- 262 Shantz Way Unit (LOT A48)
- 113 Early Dr
- 104 Early Dr
- 106 Early Dr
- 100 Early Dr
- 200 Eric Ct
- 201 Oak Ridge Dr
- 205 Oak Ridge Dr
- 202 Pine Ridge Dr
- 204 Pine Ridge Dr
- 206 Oakridge Dr
- 208 Oak Ridge Dr
- 206 Oak Ridge Dr
- 101 Dogwood Dr
- 207 Oak Ridge Dr
- 210 Oak Ridge Dr
- 0 Pine Ridge Dr Unit 3133737
- 0 Pine Ridge Dr
- 206 Pine Ridge Dr
- 102 Dogwood Dr
- 110 Pine Ridge Dr
- 212 Oak Ridge Dr
- 104 Dogwood Dr
- 119 Sweetspire Ln
- 117 Sweetspire Ln
- 209 Oak Ridge Dr