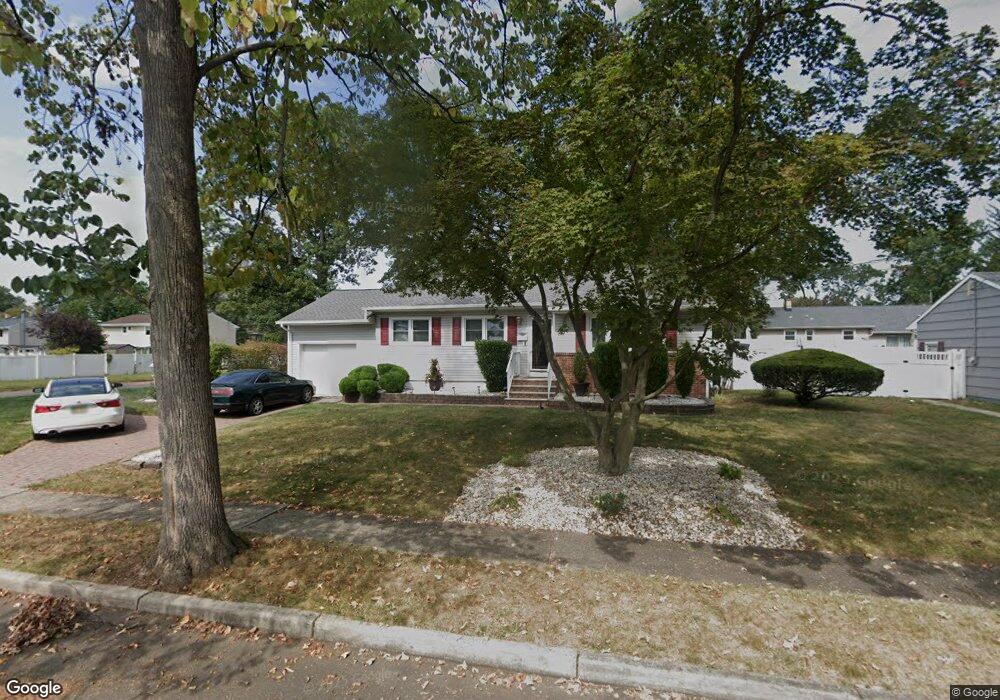
203 Olive St Piscataway, NJ 08854
Estimated Value: $482,492 - $607,000
--
Bed
--
Bath
1,252
Sq Ft
$423/Sq Ft
Est. Value
About This Home
This home is located at 203 Olive St, Piscataway, NJ 08854 and is currently estimated at $530,123, approximately $423 per square foot. 203 Olive St is a home located in Middlesex County with nearby schools including Arbor Intermediate School, Dwight D. Eisenhower School, and Quibbletown Middle School.
Ownership History
Date
Name
Owned For
Owner Type
Purchase Details
Closed on
Jun 25, 2010
Sold by
Motley Evelyn L
Bought by
Motley Evelyn L
Current Estimated Value
Home Financials for this Owner
Home Financials are based on the most recent Mortgage that was taken out on this home.
Original Mortgage
$224,999
Interest Rate
4.23%
Mortgage Type
FHA
Purchase Details
Closed on
Jul 27, 2001
Sold by
White George
Bought by
Motley Evelyn
Home Financials for this Owner
Home Financials are based on the most recent Mortgage that was taken out on this home.
Original Mortgage
$173,268
Interest Rate
7.16%
Mortgage Type
FHA
Purchase Details
Closed on
Mar 26, 1996
Sold by
Kuchta Eleanor
Bought by
White George and White Regina
Home Financials for this Owner
Home Financials are based on the most recent Mortgage that was taken out on this home.
Original Mortgage
$134,000
Interest Rate
6.9%
Mortgage Type
VA
Create a Home Valuation Report for This Property
The Home Valuation Report is an in-depth analysis detailing your home's value as well as a comparison with similar homes in the area
Home Values in the Area
Average Home Value in this Area
Purchase History
| Date | Buyer | Sale Price | Title Company |
|---|---|---|---|
| Motley Evelyn L | -- | None Available | |
| Motley Evelyn | $174,900 | -- | |
| White George | $131,000 | -- |
Source: Public Records
Mortgage History
| Date | Status | Borrower | Loan Amount |
|---|---|---|---|
| Closed | Motley Evelyn L | $224,999 | |
| Closed | Motley Evelyn | $173,268 | |
| Previous Owner | White George | $134,000 |
Source: Public Records
Tax History Compared to Growth
Tax History
| Year | Tax Paid | Tax Assessment Tax Assessment Total Assessment is a certain percentage of the fair market value that is determined by local assessors to be the total taxable value of land and additions on the property. | Land | Improvement |
|---|---|---|---|---|
| 2025 | $7,013 | $426,100 | $268,200 | $157,900 |
| 2024 | $7,177 | $359,100 | $173,000 | $186,100 |
| 2023 | $7,177 | $343,400 | $173,000 | $170,400 |
| 2022 | $7,140 | $317,200 | $173,000 | $144,200 |
| 2021 | $7,075 | $302,100 | $173,000 | $129,100 |
| 2020 | $6,814 | $291,700 | $158,000 | $133,700 |
| 2019 | $6,528 | $274,500 | $158,000 | $116,500 |
| 2018 | $6,358 | $267,600 | $158,000 | $109,600 |
| 2017 | $6,023 | $219,000 | $118,000 | $101,000 |
| 2016 | $5,906 | $219,000 | $118,000 | $101,000 |
| 2015 | $5,825 | $219,000 | $118,000 | $101,000 |
| 2014 | $5,694 | $219,000 | $118,000 | $101,000 |
Source: Public Records
Map
Nearby Homes
- 65 Curtis Ave
- 1866 W 7th St
- 503 S Washington Ave
- 1515 Dogwood Dr
- 1433 Dogwood Dr
- 203 Walnut St
- 417 Valmere Ave
- 456 Valmere Ave
- 1774 W 5th St
- 423 New Market Rd
- 615 Dial Ave
- 625 Fairview Ave
- 118 Jadach Dr
- 614 S Washington Ave
- 651 Fairview Ave
- 634 S Washington Ave
- 261 New Market Rd
- 233 Maple Ave
- 47 Brandywine Cir