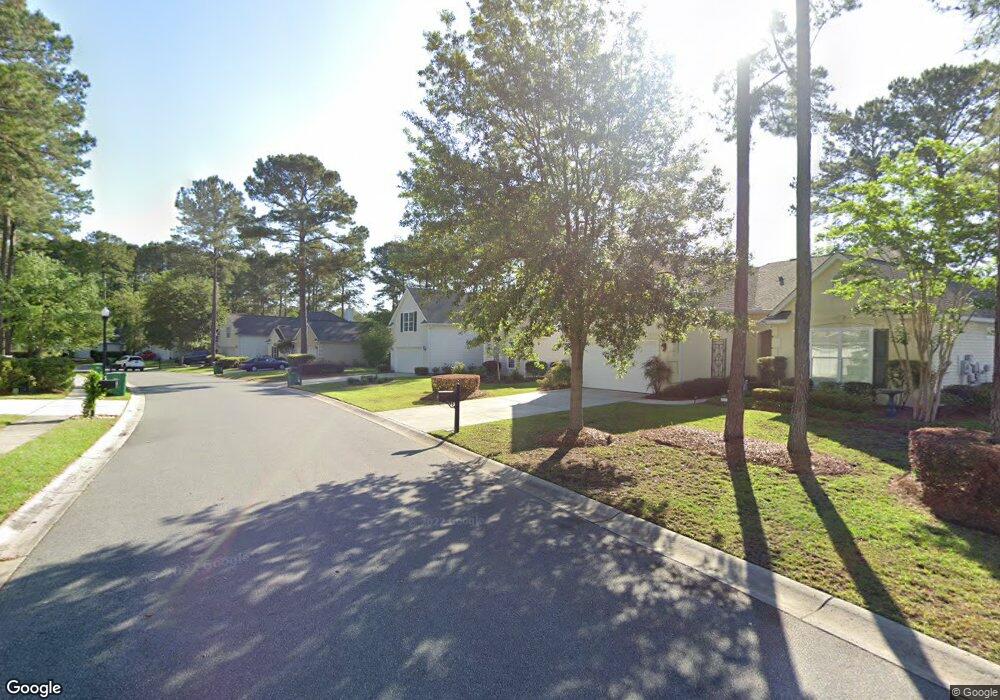
203 Pinecrest Cir Bluffton, SC 29910
Estimated Value: $521,847 - $610,000
4
Beds
3
Baths
2,541
Sq Ft
$223/Sq Ft
Est. Value
About This Home
This home is located at 203 Pinecrest Cir, Bluffton, SC 29910 and is currently estimated at $567,212, approximately $223 per square foot. 203 Pinecrest Cir is a home located in Beaufort County with nearby schools including Bluffton Elementary School, H.E. McCracken Middle School, and Bluffton High School.
Ownership History
Date
Name
Owned For
Owner Type
Purchase Details
Closed on
Oct 14, 2011
Sold by
Barefield Ernest R and Barefield Barbara W
Bought by
Barefield E R and Barefield Barbara W
Current Estimated Value
Purchase Details
Closed on
Jul 21, 2011
Sold by
Barefield Ernest R and Barefield Barbara W
Bought by
Ernest R Barefield Revocable Trust
Purchase Details
Closed on
Jul 1, 2008
Sold by
Oquinn John T and Oquinn Melissa B
Bought by
Barefield Ernest R and Barefield Barbara W
Home Financials for this Owner
Home Financials are based on the most recent Mortgage that was taken out on this home.
Original Mortgage
$83,000
Outstanding Balance
$53,246
Interest Rate
5.96%
Mortgage Type
Purchase Money Mortgage
Estimated Equity
$513,966
Purchase Details
Closed on
Dec 18, 2006
Sold by
Centex Homes
Bought by
Oquinn John T and Oquinn Melissa B
Home Financials for this Owner
Home Financials are based on the most recent Mortgage that was taken out on this home.
Original Mortgage
$151,081
Interest Rate
6.31%
Mortgage Type
Purchase Money Mortgage
Create a Home Valuation Report for This Property
The Home Valuation Report is an in-depth analysis detailing your home's value as well as a comparison with similar homes in the area
Purchase History
| Date | Buyer | Sale Price | Title Company |
|---|---|---|---|
| Barefield E R | -- | -- | |
| Ernest R Barefield Revocable Trust | -- | -- | |
| Barefield Ernest R | $310,000 | -- | |
| Oquinn John T | $351,081 | None Available |
Source: Public Records
Mortgage History
| Date | Status | Borrower | Loan Amount |
|---|---|---|---|
| Open | Barefield Ernest R | $83,000 | |
| Previous Owner | Oquinn John T | $151,081 |
Source: Public Records
Tax History
| Year | Tax Paid | Tax Assessment Tax Assessment Total Assessment is a certain percentage of the fair market value that is determined by local assessors to be the total taxable value of land and additions on the property. | Land | Improvement |
|---|---|---|---|---|
| 2024 | $5,588 | $19,984 | $3,860 | $16,124 |
| 2023 | $1,935 | $19,984 | $3,860 | $16,124 |
| 2022 | $1,745 | $12,928 | $3,200 | $9,728 |
| 2021 | $1,731 | $12,928 | $3,200 | $9,728 |
| 2020 | $1,724 | $12,928 | $3,200 | $9,728 |
| 2019 | $1,673 | $12,928 | $3,200 | $9,728 |
| 2018 | $1,644 | $11,620 | $0 | $0 |
| 2017 | $1,425 | $10,110 | $0 | $0 |
| 2016 | $1,425 | $10,110 | $0 | $0 |
| 2014 | $1,589 | $10,110 | $0 | $0 |
Source: Public Records
Map
Nearby Homes
- 19 Ironwood Cir
- 22 Bluehaw Ct
- 262 Buck Island Rd
- 8 Buckhorn St
- 256 Pinecrest Cir
- 3 Plumgrass St
- 5 Glenwood Springs Ct
- 136 Pinecrest Dr
- 106 Pinecrest Dr
- 254 Lockwood Dr
- 163 Pinecrest Dr
- 171 Buck Island Rd
- 10 Canters Cir
- 30 Sugaree Dr
- 13 Gables Ln
- 0 Simmonsville Rd Unit 502506
- 71 Crossings Blvd
- 29 Gables Ln
- 392 Station Pkwy
- 45 Linden Park Dr
- 201 Pinecrest Cir
- 205 Pinecrest Cir
- 199 Pinecrest Cir
- 207 Pinecrest Cir
- 200 Pinecrest Cir
- 198 Pinecrest Cir
- 202 Pinecrest Cir
- 196 Pinecrest Cir
- 197 Pinecrest Cir
- 204 Pinecrest Cir
- 211 Pinecrest Cir
- 194 Pinecrest Cir
- 195 Pinecrest Cir
- 206 Pinecrest Cir
- 213 Pinecrest Cir
- 208 Pinecrest Cir
- 193 Pinecrest Cir
- 242 Bleecker St S Unit 34
- 230 Bleecker St S Unit 36
- 230 Bleecker St S
Your Personal Tour Guide
Ask me questions while you tour the home.