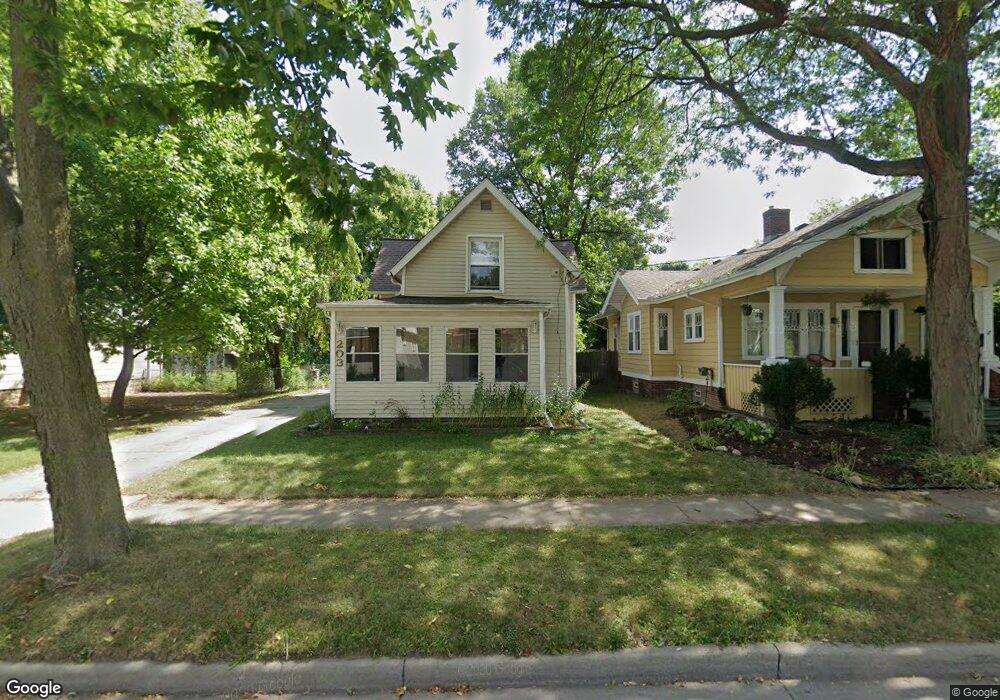
203 Regent St Lansing, MI 48912
Fairview Area NeighborhoodEstimated Value: $132,000 - $159,000
4
Beds
2
Baths
1,286
Sq Ft
$112/Sq Ft
Est. Value
About This Home
This home is located at 203 Regent St, Lansing, MI 48912 and is currently estimated at $143,394, approximately $111 per square foot. 203 Regent St is a home located in Ingham County with nearby schools including Pattengill Academy, Riddle Elementary School, and Eastern High School.
Ownership History
Date
Name
Owned For
Owner Type
Purchase Details
Closed on
Jul 6, 2015
Sold by
Roberts Mary Lee
Bought by
Cooney Tracy Ann and Cooney Ricardo
Current Estimated Value
Purchase Details
Closed on
Jul 8, 2011
Sold by
Downing Abigail M and Wuerth Ryan M
Bought by
Roberts Mary Lee
Purchase Details
Closed on
May 26, 2011
Sold by
Nationstar Mortgage Llc
Bought by
Fannie Mae
Purchase Details
Closed on
May 19, 2011
Sold by
Downing Abigail M and Wuerth Ryan M
Bought by
Nationstar Mortgage Llc
Purchase Details
Closed on
Jun 5, 2007
Sold by
Flanders James L and Flanders Susan M
Bought by
Downing Abigail M and Wuerth Ryan M
Home Financials for this Owner
Home Financials are based on the most recent Mortgage that was taken out on this home.
Original Mortgage
$93,500
Interest Rate
6.21%
Mortgage Type
Purchase Money Mortgage
Create a Home Valuation Report for This Property
The Home Valuation Report is an in-depth analysis detailing your home's value as well as a comparison with similar homes in the area
Home Values in the Area
Average Home Value in this Area
Purchase History
| Date | Buyer | Sale Price | Title Company |
|---|---|---|---|
| Cooney Tracy Ann | -- | None Available | |
| Roberts Mary Lee | $50,000 | Tri Title Agency Llc | |
| Fannie Mae | -- | None Available | |
| Nationstar Mortgage Llc | $97,365 | None Available | |
| Downing Abigail M | $93,500 | Tri County Title Agency Llc |
Source: Public Records
Mortgage History
| Date | Status | Borrower | Loan Amount |
|---|---|---|---|
| Previous Owner | Downing Abigail M | $93,500 |
Source: Public Records
Tax History
| Year | Tax Paid | Tax Assessment Tax Assessment Total Assessment is a certain percentage of the fair market value that is determined by local assessors to be the total taxable value of land and additions on the property. | Land | Improvement |
|---|---|---|---|---|
| 2025 | $3,326 | $60,600 | $5,200 | $55,400 |
| 2024 | $28 | $53,400 | $5,200 | $48,200 |
| 2023 | $3,130 | $46,300 | $5,200 | $41,100 |
| 2022 | $2,857 | $40,300 | $4,200 | $36,100 |
| 2021 | $2,790 | $39,700 | $7,100 | $32,600 |
| 2020 | $2,771 | $38,200 | $7,100 | $31,100 |
| 2019 | $2,678 | $34,200 | $7,100 | $27,100 |
| 2018 | $2,539 | $33,200 | $7,100 | $26,100 |
| 2017 | $2,444 | $33,200 | $7,100 | $26,100 |
| 2016 | $2,195 | $31,900 | $7,100 | $24,800 |
| 2015 | $2,195 | $29,700 | $14,159 | $15,541 |
| 2014 | $2,195 | $29,200 | $11,012 | $18,188 |
Source: Public Records
Map
Nearby Homes
- 1713 Stanley Ct
- 421 S Clemens Ave
- 122 Allen St
- 508 Leslie St
- 404 S Hayford Ave
- 517 S Clemens Ave
- 121 Lathrop St
- 520 Leslie St
- 528 S Fairview Ave
- 411 S Hayford Ave
- 400 Lathrop St
- 228 Marshall St
- 129 Clifford St
- 218 N Magnolia Ave Unit 1
- 607 Shepard St Unit 2
- 619 Shepard St
- 311 N Magnolia Ave
- 537 Lathrop St
- 135 S Francis Ave
- 509 Clifford St
- 205 Regent St
- 139 Regent St
- 211 Regent St
- 135 Regent St
- 204 S Clemens Ave
- 210 S Clemens Ave
- 200 S Clemens Ave
- 217 Regent St
- 214 S Clemens Ave
- 216 S Clemens Ave
- 134 S Clemens Ave
- 218 S Clemens Ave
- 219 Regent St
- 132 S Clemens Ave
- 204 Regent St
- 200 Regent St
- 206 Regent St
- 138 Regent St
- 134 Regent St
- 210 Regent St
Your Personal Tour Guide
Ask me questions while you tour the home.