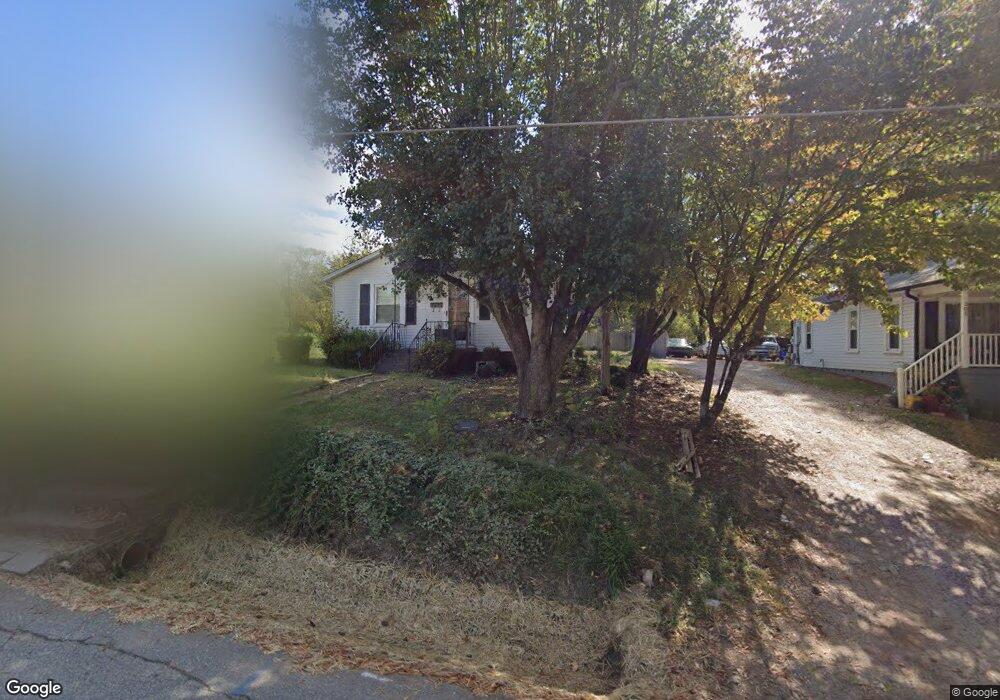
203 Rice St Kannapolis, NC 28081
Estimated Value: $139,000 - $226,000
--
Bed
2
Baths
1,065
Sq Ft
$161/Sq Ft
Est. Value
About This Home
This home is located at 203 Rice St, Kannapolis, NC 28081 and is currently estimated at $171,064, approximately $160 per square foot. 203 Rice St is a home located in Rowan County with nearby schools including Landis Elementary School, Corriher Lipe Middle School, and South Rowan High School.
Ownership History
Date
Name
Owned For
Owner Type
Purchase Details
Closed on
Jun 25, 2021
Sold by
Phifer Marsha L L and Coaldwell Harold David
Bought by
Jordan Justin
Current Estimated Value
Home Financials for this Owner
Home Financials are based on the most recent Mortgage that was taken out on this home.
Original Mortgage
$80,000
Outstanding Balance
$72,588
Interest Rate
2.9%
Mortgage Type
New Conventional
Estimated Equity
$98,476
Purchase Details
Closed on
Oct 21, 2013
Sold by
Long Arnetta R and Phifer Coaldwell Lynnette
Bought by
Long Arnetta R and Phifer Coaldwell Lynnette
Purchase Details
Closed on
May 29, 2009
Sold by
Phifer Coaldwell Lynnette and Long Vivian Carol
Bought by
Phifer Coaldwell Lynnette and Long Vivian Carol
Create a Home Valuation Report for This Property
The Home Valuation Report is an in-depth analysis detailing your home's value as well as a comparison with similar homes in the area
Home Values in the Area
Average Home Value in this Area
Purchase History
| Date | Buyer | Sale Price | Title Company |
|---|---|---|---|
| Jordan Justin | $100,000 | None Available | |
| Long Arnetta R | -- | None Available | |
| Phifer Coaldwell Lynnette | -- | None Available |
Source: Public Records
Mortgage History
| Date | Status | Borrower | Loan Amount |
|---|---|---|---|
| Open | Jordan Justin | $80,000 |
Source: Public Records
Tax History Compared to Growth
Tax History
| Year | Tax Paid | Tax Assessment Tax Assessment Total Assessment is a certain percentage of the fair market value that is determined by local assessors to be the total taxable value of land and additions on the property. | Land | Improvement |
|---|---|---|---|---|
| 2025 | $1,398 | $115,555 | $16,413 | $99,142 |
| 2024 | $1,398 | $115,555 | $16,413 | $99,142 |
| 2023 | $1,398 | $115,555 | $16,413 | $99,142 |
| 2022 | $847 | $65,756 | $12,625 | $53,131 |
| 2021 | $847 | $65,756 | $12,625 | $53,131 |
| 2020 | $847 | $65,756 | $12,625 | $53,131 |
| 2019 | $847 | $65,756 | $12,625 | $53,131 |
| 2018 | $755 | $59,274 | $12,625 | $46,649 |
| 2017 | $755 | $59,274 | $12,625 | $46,649 |
| 2016 | $755 | $59,274 | $12,625 | $46,649 |
| 2015 | $766 | $59,274 | $12,625 | $46,649 |
| 2014 | $709 | $56,732 | $11,110 | $45,622 |
Source: Public Records
Map
Nearby Homes
- 2401 Brookview Ave
- 0 Summit Ave
- 2909 Glendale Ave
- 2885 Vale Ave
- 203 E 22nd St
- 515 Rosemont Ave
- 107 W 21st St
- 2003 Plaza Ave
- 204 E 27th St
- 0 Vale Ave
- 400 E 27th St
- 304 E 21st St
- 2653 Brady Ave
- 408 E 22nd St
- 531 Sand Dunes Dr
- 513 Sand Dunes Dr
- 519 Sand Dunes Dr
- 201 W 19th St
- 413 E 25th St
- 525 Sand Dunes Dr