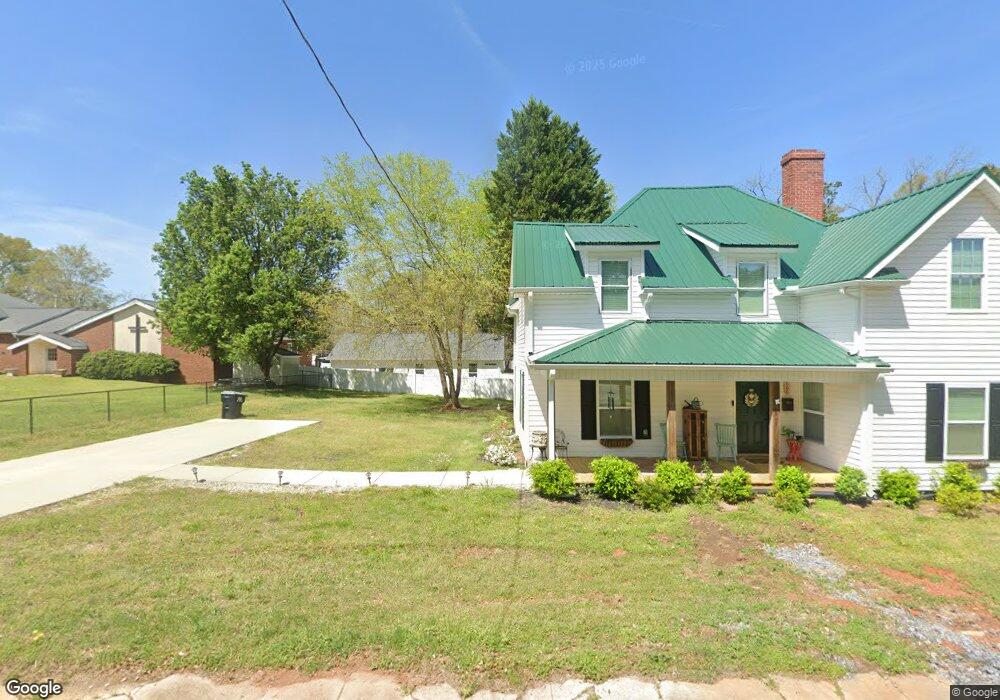
203 River St Belton, SC 29627
Estimated Value: $166,000 - $279,000
2
Beds
--
Bath
937
Sq Ft
$256/Sq Ft
Est. Value
About This Home
This home is located at 203 River St, Belton, SC 29627 and is currently estimated at $239,503, approximately $255 per square foot. 203 River St is a home located in Anderson County with nearby schools including Belton Honea Path High School.
Ownership History
Date
Name
Owned For
Owner Type
Purchase Details
Closed on
Oct 23, 2024
Sold by
Franks Brandon N
Bought by
Hill Cathy Ann
Current Estimated Value
Home Financials for this Owner
Home Financials are based on the most recent Mortgage that was taken out on this home.
Original Mortgage
$189,900
Outstanding Balance
$187,846
Interest Rate
6.2%
Mortgage Type
New Conventional
Estimated Equity
$51,657
Purchase Details
Closed on
Dec 15, 2023
Sold by
Pinnacle Properties Of The Upstate Llc
Bought by
Franks Brandon N
Purchase Details
Closed on
Dec 16, 2020
Sold by
Kahl Properties Llc
Bought by
Pinnacle Properties Of The Update Llc
Create a Home Valuation Report for This Property
The Home Valuation Report is an in-depth analysis detailing your home's value as well as a comparison with similar homes in the area
Home Values in the Area
Average Home Value in this Area
Purchase History
| Date | Buyer | Sale Price | Title Company |
|---|---|---|---|
| Hill Cathy Ann | $249,900 | None Listed On Document | |
| Franks Brandon N | $25,000 | None Listed On Document | |
| Pinnacle Properties Of The Update Llc | $60,000 | None Available | |
| Kahi Properties Llc | $45,000 | None Available |
Source: Public Records
Mortgage History
| Date | Status | Borrower | Loan Amount |
|---|---|---|---|
| Open | Hill Cathy Ann | $189,900 |
Source: Public Records
Tax History
| Year | Tax Paid | Tax Assessment Tax Assessment Total Assessment is a certain percentage of the fair market value that is determined by local assessors to be the total taxable value of land and additions on the property. | Land | Improvement |
|---|---|---|---|---|
| 2024 | $2,576 | $1,500 | $1,500 | $0 |
| 2023 | $931 | $2,810 | $360 | $2,450 |
| 2022 | $1,368 | $2,810 | $360 | $2,450 |
| 2021 | $1,310 | $2,660 | $360 | $2,300 |
| 2020 | $833 | $2,660 | $360 | $2,300 |
| 2019 | $830 | $2,660 | $360 | $2,300 |
| 2018 | $827 | $2,660 | $360 | $2,300 |
| 2017 | -- | $2,660 | $360 | $2,300 |
| 2016 | $713 | $2,780 | $300 | $2,480 |
| 2015 | $726 | $2,780 | $300 | $2,480 |
| 2014 | $718 | $2,780 | $300 | $2,480 |
Source: Public Records
Map
Nearby Homes
- 222 Saluda St
- 129 Holloway Blvd
- 228 Saluda St
- 230 Saluda St
- 305 Saluda St
- River Street River St
- 104 Cox Dr
- 114 Mahaffey St
- 00 Holiday Dam Rd
- 310 S Main St
- 304 Cherry St
- 5 McGee St
- 113 Guthrie Ave
- 301 Blue Ridge Ave
- 108 Oak St
- 311 Blue Ridge Ave
- 608 Brown Ave
- 136 Rice St
- 402 Woodland Cir
- 403 Blue Ridge Ave
Your Personal Tour Guide
Ask me questions while you tour the home.